Tag: xbb.1.9.1

  • National numbers, April 9

    National numbers, April 9

    COVID-19 spread is at a plateau in all four major regions of the U.S., according to wastewater data from Biobot.

    In the past week (March 30 through April 5), the U.S. officially reported about 120,000 new COVID-19 cases, according to the CDC. This amounts to:

    • An average of 17,000 new cases each day
    • 37 total new cases for every 100,000 Americans
    • 12% fewer new cases than last week (March 23-29)

    In the past week, the U.S. also reported about 15,000 new COVID-19 patients admitted to hospitals. This amounts to:

    • An average of 2,100 new admissions each day
    • 4.5 total admissions for every 100,000 Americans
    • 12% fewer new admissions than last week

    Additionally, the U.S. reported:

    • 1,800 new COVID-19 deaths (250 per day)
    • 88% of new cases are caused by Omicron XBB.1.5; 5% by XBB.1.9.1; 2% by XBB.1.5.1; 0.4% by CH.1.1 (as of April 8)
    • An average of 40,000 vaccinations per day

    COVID-19 spread in the U.S. remains at a high plateau, according to reported cases, hospitalizations, and wastewater surveillance. Experts are watching new variants that mutated from XBB as potential drivers of more transmission this spring.

    While the case numbers may seem low, remember that cases are now severely undercounted—potentially by up to 20 times. So, when the CDC reported about 37 new cases per 100,000 people last week, the true number could be closer to 700 new cases per 100,000. It’s becoming harder and harder to get a PCR test, as sites shut down and the federal health emergency’s end approaches, which will further drive undercounting.

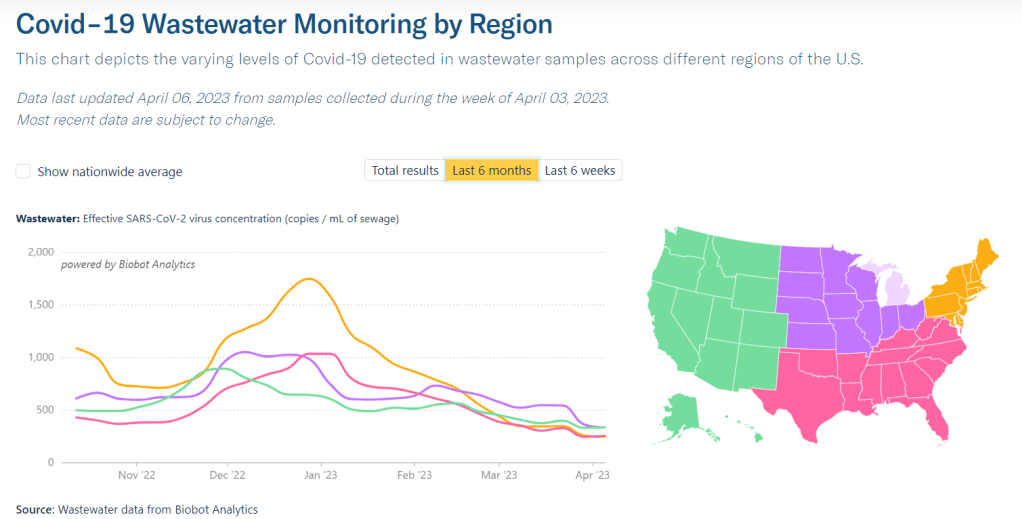
    Wastewater data, on the other hand, continue to show that coronavirus levels in the U.S. are significantly higher than they were at this time in 2022 and 2021. Last week, I wrote that Biobot’s dashboard showed a slight increase in COVID-19 spread across the country; after this week’s data updates, that appears to have been a blip, with the company’s national surveillance again showing a plateau.

    Biobot’s regional data also indicates that COVID-19 spread has remained relatively consistent in the last few weeks. The Northeast and Midwest have slightly higher coronavirus levels than the South and West, but there aren’t significant differences between these regions.

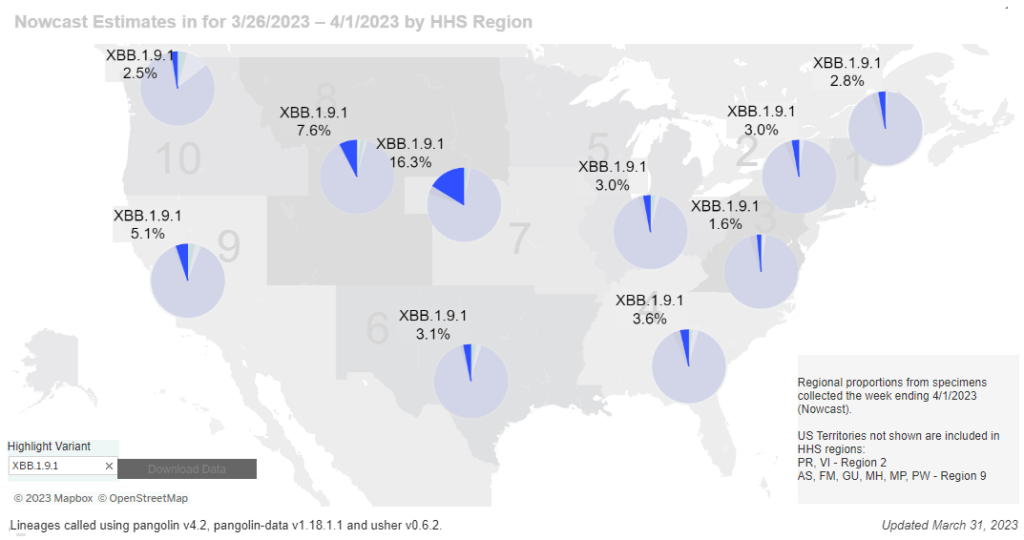
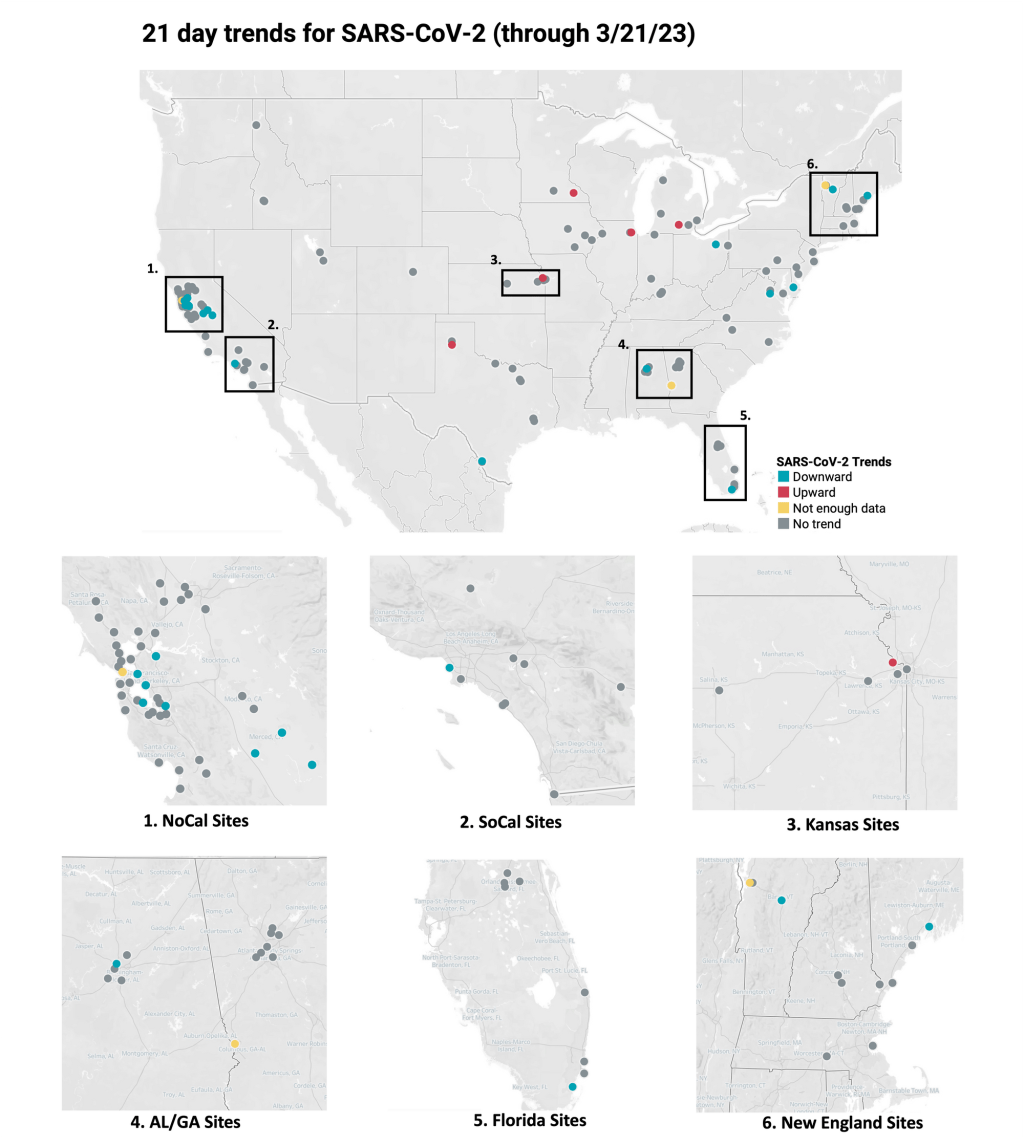
    As I wrote last week, new subvariant XBB.1.9.1 remains more prevalent in the Midwest, particularly the region including Iowa, Kansas, Missouri, and Nebraska (where it caused about 18% of new cases in the last week, per CDC estimates). Some wastewater testing sites in these states have reported increases recently, but there isn’t a consistent increase across the board.

    Nationally, the CDC estimates that XBB.1.9.1 caused about 5% of new cases nationwide in the week ending April 8, compared to 88% caused by XBB.1.5. XBB.1.9.1 has been growing relatively slowly, so it may be a few more weeks before we see it either outcompete XBB.1.5 or die out at low levels. Experts are also watching XBB.1.16, which drove a surge in India recently but has not shown up in large numbers in the U.S. yet.

    Will the U.S. see a new surge this spring? It seems possible, thanks to Omicron’s continued evolution and our lack of collective safety measures. But continued declines in data reporting will make it harder to see this surge than it’s ever been.

    In this environment, wastewater surveillance is growing more and more valuable. It’s also probably a good idea to keep taking some basic precautions (like masking in public indoor spaces, or regularly testing) no matter how low the reported cases get in your community.

  • National numbers, April 2

    National numbers, April 2

    New subvariant Omicron XBB.1.9.1 is most prevalent in the Midwest, according to CDC estimates.

    In the past week (March 23 through 29), the U.S. officially reported about 140,000 new COVID-19 cases, according to the CDC. This amounts to:

    • An average of 20,000 new cases each day
    • 43 total new cases for every 100,000 Americans
    • 9% fewer new cases than last week (March 16-22)

    In the past week, the U.S. also reported about 17,000 new COVID-19 patients admitted to hospitals. This amounts to:

    • An average of 2,400 new admissions each day
    • 5.1 total admissions for every 100,000 Americans
    • 5% fewer new admissions than last week

    Additionally, the U.S. reported:

    • 1,600 new COVID-19 deaths (230 per day)
    • 88% of new cases are caused by Omicron XBB.1.5; 5% by XBB.1.9.1; 2% by XBB.1.5.1; 0.4% by CH.1.1 (as of March 18)
    • An average of 40,000 vaccinations per day

    While official COVID-19 cases and hospitalizations continue to trend ever-so-slightly downward, wastewater surveillance data show potential new upticks in transmission. Despite continued minimal safety measures in most places, we have to remain wary of a potential spring surge.

    Official data from the CDC suggested that cases and new hospital admissions dropped very slightly last week, compared to the week prior. But case data continue to be plagued with reporting delays; again this week, multiple states (Florida, Delaware, Mississippi, Oklahoma) reported no cases or had other issues. These delays make it difficult to assess patterns at state or county levels.

    Wastewater surveillance data provide more accurate early warnings about potential rising transmission. This week, Biobot’s data suggest slight increases in all four major regions of the country. It’s worth noting, though, that Biobot’s most recent data are preliminary. I’ll be closely watching the dashboard’s next updates, this coming Tuesday and Thursday.

    The latest Omicron variant of concern, XBB.1.9.1, could be one reason for increasing coronavirus levels. This subvariant caused an estimated 5% of new cases across the country nationwide last week, according to the CDC’s Nowcast analysis. At the same time, XBB.1.5 has declined for the first time since it emerged a couple of months ago, suggesting XBB.1.9.1 might slowly outcompete it.

    XBB.1.9.1 is most prevalent in the Midwest, particularly the region including Iowa, Kansas, Missouri, and Nebraska. Some counties in this region are also reporting significant coronavirus increases in their wastewater, according to Biobot and WastewaterSCAN. Missouri’s wastewater dashboard similarly shows increases across the state.

    In our current era of high background coronavirus spread (and few-to-no widespread safety measures), a new variant can easily cause concerning outbreaks. It’s important to remember that, no matter how much the virus evolves, simple measures like masks and ventilation can still make transmission less likely.

  • National numbers, March 26

    National numbers, March 26

    Data from WastewaterSCAN suggest that most sites in its network saw downward coronavirus trends or plateaus in recent weeks.

    In the past week (March 16 through 22), the U.S. officially reported about 130,000 new COVID-19 cases, according to the CDC. This amounts to:

    • An average of 19,000 new cases each day
    • 41 total new cases for every 100,000 Americans
    • 13% fewer new cases than last week (March 9-15)

    In the past week, the U.S. also reported about 17,000 new COVID-19 patients admitted to hospitals. This amounts to:

    • An average of 2,400 new admissions each day
    • 5.2 total admissions for every 100,000 Americans
    • 9% fewer new admissions than last week

    Additionally, the U.S. reported:

    • 2,000 new COVID-19 deaths (300 per day)
    • 90% of new cases are caused by Omicron XBB.1.5; 3% by XBB.1.9.1; 2% by XBB.1.5.1; 0.4% by CH.1.1 (as of March 18)
    • An average of 40,000 vaccinations per day

    Nationally, we continue to see the same slow decline of COVID-19 spread across the U.S., as shown by official case data, hospitalizations, and wastewater surveillance.

    Reported cases dropped by 13% last week compared to the week prior, while new hospital admissions dropped by 9%. As I’ve noted in the last couple of updates, the CDC continues to deal with reporting delays from different state health departments. This week, Texas, Arkansas, Florida, and Indiana did not report cases to the CDC.

    Wastewater surveillance data from Biobot and the WastewaterSCAN project suggest that COVID-19 levels are at slow declines or plateaus in most parts of the country, but some places may be seeing small increases. Biobot’s dashboard shows slight upticks in the Northeast, Midwest, and West coast regions, as of its March 22 update. 

    Overall, Biobot’s data suggests that national coronavirus concentrations are lower than they’ve been in about a year—but still higher than we’ve seen at this point in 2021 and 2022. The low case numbers that health departments are putting out mask a high baseline of infections, in which many people are not getting PCR tests or reporting their cases to the healthcare system.

    Data from the WastewaterSCAN project suggest that most of the project’s 148 monitoring sites reported downward trends or plateaus in coronavirus levels over the last three weeks. A few places have reported upticks, though, including sites in Kansas, Michigan, South Carolina, Massachusetts, and Oklahoma. 

    One reason for these upticks could be XBB.1.9.1, the latest Omicron subvariant to draw concern among virologists. The CDC started reporting estimates for XBB.1.9.1 in its latest variant update (this Friday): the agency estimates that this variant caused 2.5% of new cases nationwide last week, with higher prevalence (about 13%) in the Midwest region that includes Iowa, Kansas, Missouri, and Nebraska.

    XBB.1.9.1 is doubling “roughly every 8 days,” according to Marc Johnson, a virologist at the University of Missouri who leads the state’s wastewater surveillance program. Johnson predicts that this subvariant will be dominant in the U.S. by the end of April, but it could face competition from XBB.1.16—another descendant of XBB that has been spreading rapidly in India. 

    Could the spread of these XBB sublineages across the U.S. cause a significant rise in cases and hospitalizations? It’s hard to say, given the complex picture of immunity in the country, with millions of people recently infected by a variety of variants. “Future waves are getting harder and harder to forecast,” Katelyn Jetelina wrote in Your Local Epidemiologist this week. Regardless, the same safety measures (masks, testing, etc.) continue to work against all new versions of the virus.