Tag: Wastewater

  • Wastewater surveillance expands beyond COVID-19

    I have a new story up this week at Science News, describing how the field of wastewater surveillance exploded during the COVID-19 pandemic and is now looking toward other public health threats.

    As long-time readers know, wastewater surveillance has been one of my favorite topics to cover over the last couple of years. I’m fascinated by the potential to better understand our collective health through tracking our collective poop—and by all the challenges that this area of research faces, from navigating interdisciplinary collaborations to interpreting a very new type of data to obtaining funding for continued testing.

    My story for Science News builds on other reporting I’ve done on this topic and provides a comprehensive overview of the growing wastewater surveillance field, with a particular focus on how research is now going beyond COVID-19. There’s so much potential here that, as I point out in the story, many researchers are asking not, “What can we test for?” but “What should we test for?”

    Here’s the story’s introduction; go to Science News for the full article:

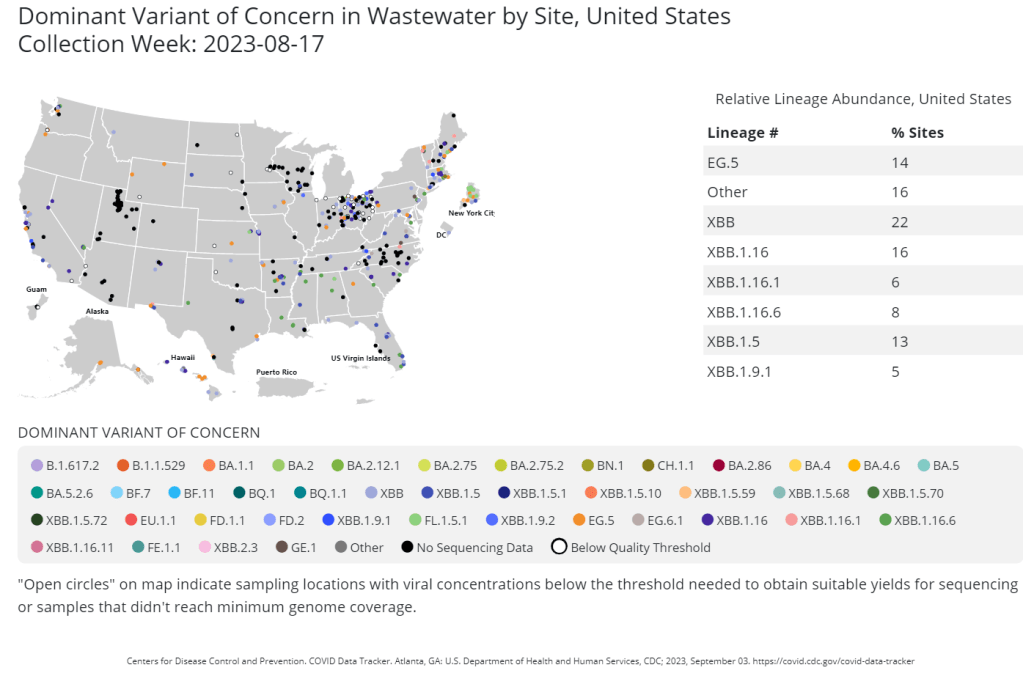
    The future of disease tracking is going down the drain — literally. Flushed with success over detecting coronavirus in wastewater, and even specific variants of SARS-CoV-2, the virus that causes COVID-19, researchers are now eyeing our collective poop to monitor a wide variety of health threats.

    Before the pandemic, wastewater surveillance was a smaller field, primarily focused on testing for drugs or mapping microbial ecosystems. But these researchers were tracking specific health threats in specific places — opioids in parts of Arizona, polio in Israel — and hadn’t quite realized the potential for national or global public health.

    Then COVID-19 hit.

    The pandemic triggered an “incredible acceleration” of wastewater science, says Adam Gushgari, an environmental engineer who before 2020 worked on testing wastewater for opioids. He now develops a range of wastewater surveillance projects for Eurofins Scientific, a global laboratory testing and research company headquartered in Luxembourg.

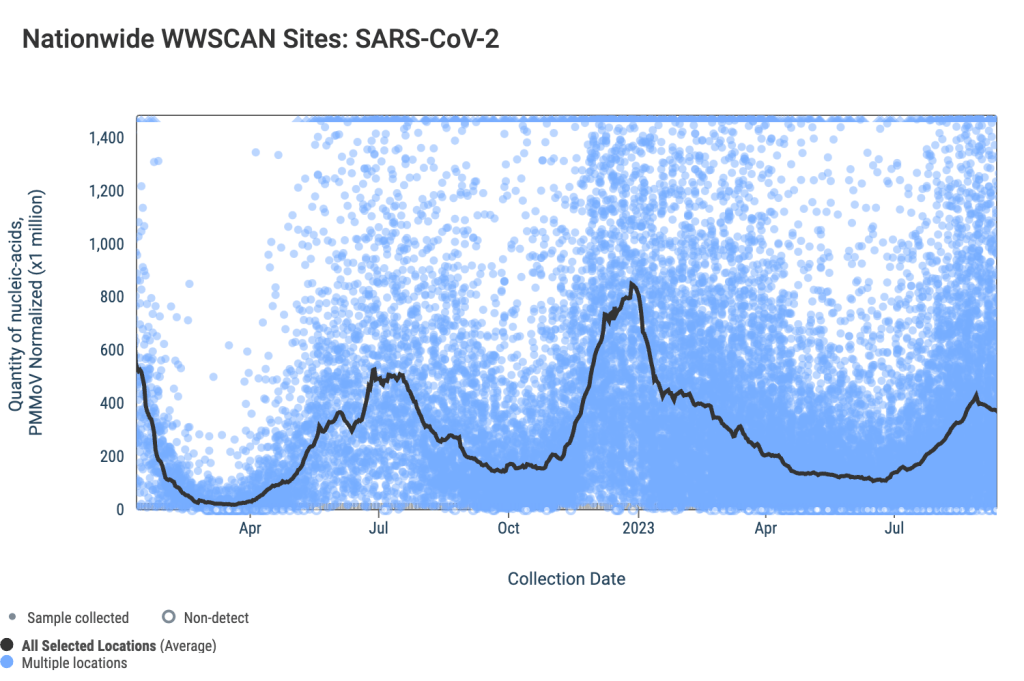
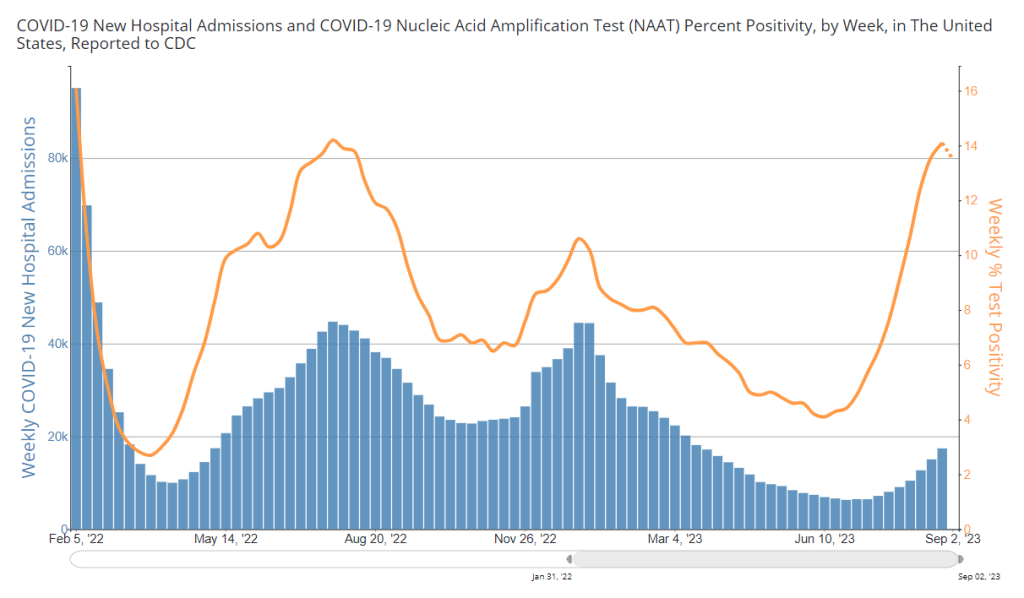
    A subfield that was once a few handfuls of specialists has grown into more than enough scientists to pack a stadium, he says. And they come from a wide variety of fields — environmental science, analytical chemistry, microbiology, epidemiology and more — all collaborating to track the coronavirus, interpret the data and communicate results to the public. With other methods of monitoring COVID-19 on the decline, wastewater surveillance has become one of health experts’ primary sources for spotting new surges.

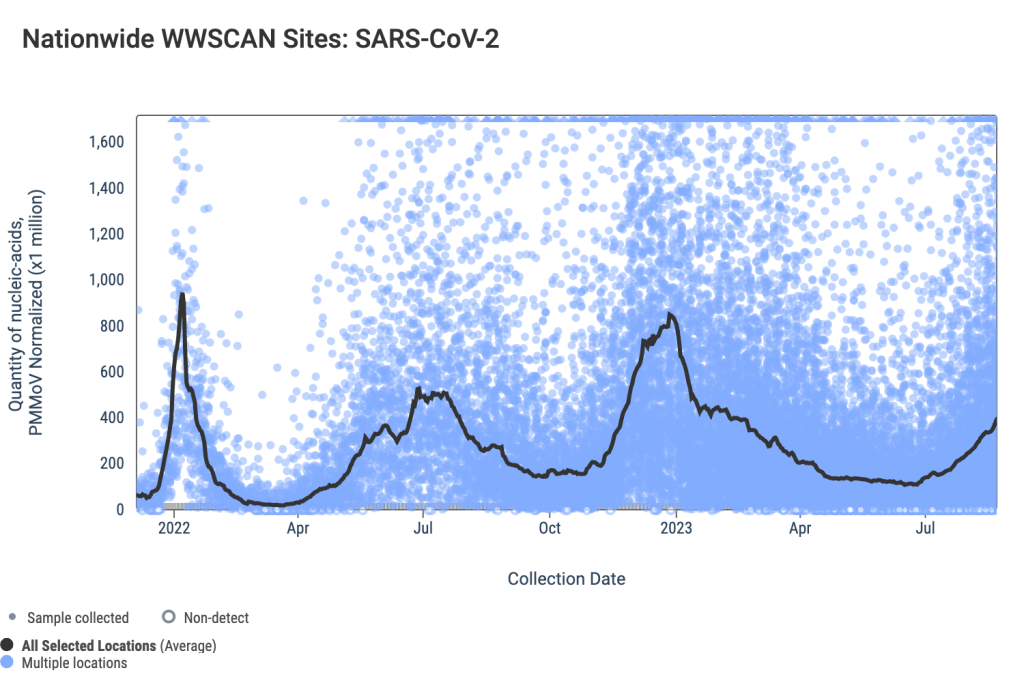
    Hundreds of wastewater treatment plants across the United States are now part of COVID-19 testing programs, sending their data to the National Wastewater Surveillance System, or NWSS, a monitoring program launched in fall 2020 by the U.S. Centers for Disease Control and Prevention. Hundreds more such testing programs have launched globally, as tracked by the COVIDPoops19 dashboard run by researchers at the University of California, Merced.

    In the last year, wastewater scientists have started to consider what else could be tracked through this new infrastructure. They’re looking at seasonal diseases like the flu, recently emerging diseases like bird flu and mpox, formerly called monkeypox, as well as drug-resistant pathogens like the fungus Candida auris. The scientists are even considering how to identify entirely new threats.

    Wastewater surveillance will have health impacts “far broader than COVID,” predicts Amy Kirby, a health scientist at the CDC who leads NWSS.

    But there are challenges getting from promise to possible. So far, such sewage surveillance has been mostly a proof of concept, confirming data from other tracking systems. Experts are still determining how data from our poop can actually inform policy; that’s true even for COVID-19, now the poster child for this monitoring. And they face public officials wary of its value and questions over whether, now that COVID-19 health emergencies have ended, the pipeline of funding will be cut off.

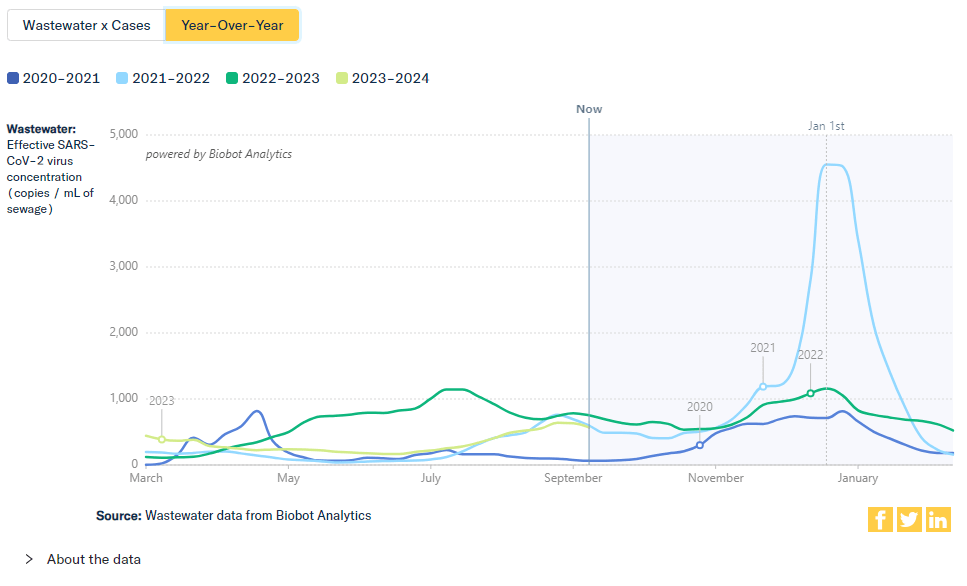
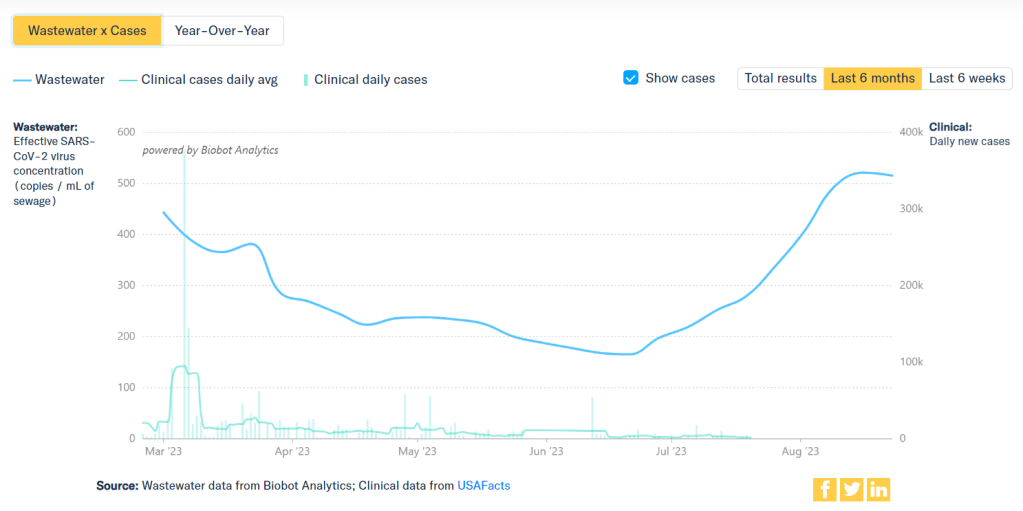
    This monitoring will hopefully become “one of the technologies that really evolves post-pandemic to be here to stay,” says Mariana Matus, cofounder of Biobot Analytics, a company based in Cambridge, Mass., that has tested sewage for the CDC and many other health agencies. But for that to happen, the technology needs continued buy-in from governments, research institutions and the public, Matus and other scientists say.

  • National numbers, September 24

    National numbers, September 24

    Data from the WastewaterSCAN network suggests that COVID-19 spread has leveled off somewhat after this summer’s increase.

    During the most recent week of data available (September 3-9), the U.S. reported about 20,500 new COVID-19 patients admitted to hospitals, according to the CDC. This amounts to:

    • An average of 2,900 new admissions each day
    • 6.3 total admissions for every 100,000 Americans
    • 8% more new admissions than the prior week (August 27-September 2)

    Additionally, the U.S. reported:

    • 12.5% of tests in the CDC’s surveillance network came back positive
    • A 5% lower concentration of SARS-CoV-2 in wastewater than last week (as of September 13, per Biobot’s dashboard)
    • 25% of new cases are caused by Omicron EG.5, 24% by XBB.1.6, 14% by FL.1.5.1 (as of September 16)

    The COVID-19 plateau that I’ve described over the last couple of weeks continues, with wastewater and test positivity data showing that viral spread has slowed in much of the U.S. However, this is likely just a lull before respiratory virus season starts in earnest.

    National wastewater data from the WastewaterSCAN project suggest that COVID-19 spread has leveled off in recent weeks, after rising throughout July and August. Biobot Analytics’ data present a similar picture, though the company didn’t update its data this past Thursday (so the most recent numbers are as of September 13).

    SCAN and Biobot’s data both show plateaus or declines in all four major regions. But the Northeast and Midwest are reporting more coronavirus in their wastewater sites (at least, in aggregate) than the South and West Coast.

    Some sewersheds in the Northeast and Midwest regions have reported increases in recent weeks, while others are leveling off. In Boston and New York City, for example, most sewersheds report declines or plateaus; while sewersheds in Kansas City and Lawrence, Kansas report upward trends.

    To find wastewater data for your region, check the Biobot, WastewaterSCAN, and CDC dashboards. I maintain a list of national, state, and a few local wastewater surveillance dashboards on the COVID-19 Data Dispatch website.

    National COVID-19 test positivity is also trending slightly down, according to the CDC’s surveillance network. Test positivity fell slightly to 12.5% in the week ending September 16, from over 14% in the prior three weeks. Walgreens’ testing data show a continued decline in positivity as well.

    Hospital admissions for COVID-19 are still going up, according to the CDC—though these data are reported with a significant delay. More than 20,000 people were hospitalized with COVID-19 during the week ending September 9, demonstrating that this disease can still cause severe symptoms. And the CDC has no surveillance data on Long COVID, making that similarly-harmful outcome less visible.

    It’s now officially fall, and October marks the start of the respiratory virus season—meaning we can expect more spread of the flu, RSV, and other pathogens along with COVID-19. This is a good time to stock up on high-quality masks, air filters, and other tools that help protect against multiple diseases.

  • Sources and updates, September 17

    • Public comments to the CDC about infection control measures: The People’s CDC, a public health communication and advocacy organization that seeks to fill gaps left by the federal CDC, has published a database of comments about the importance of infection control measures in healthcare settings. These comments were sent to the CDC’s Healthcare Infection Control Practices Advisory Committee (HICPAC), as the committee considers changing the agency’s guidance to be more lenient about preventing infections in healthcare settings. As the CDC has not published comments publicly itself, the People’s CDC “asked people to forward us their comments to HICPAC, and created the People’s Register.” For more details about HICPAC, see this post.
    • Recommendations for masks, nasal sprays, other tools: In response to last week’s post discussing how nasal sprays may be used to reduce COVID-19 risk, a reader shared this video from RTHM Health, a telehealth clinic focused on Long COVID and related complex chronic diseases. “This video has a section with a good overview of different sprays and the strength of evidence for each one,” the reader wrote. The video also includes recommendations for high-quality reusable masks and respirators, along with other COVID-19 safety tools.
    • Wastewater surveillance for flu, RSV: A new study, published this week in the CDC’s Morbidity and Mortality Weekly Report, discusses how wastewater surveillance can complement other methods of monitoring the flu and respiratory syncytial virus (RSV). Researchers at Wisconsin’s state health department, the CDC, and other collaborators tracked flu and RSV in three Wisconsin cities’ sewage during last winter’s respiratory virus season. They found that wastewater trends “often preceded a rise” in emergency department visits for these viruses. This study follows other research that has shown wastewater surveillance can be a predictive tool for many diseases, not just COVID-19.
    • Better understanding coronavirus interactions with human cells: Another recent study, published in the journal Viruses, discusses how SARS-CoV-2 interacts with the proteins in human cells as it replicates. The research team (based at the University of California Riverside) identified a specific cellular process that the virus’ N protein hijacks and uses to copy its genetic material, leading to more coronavirus in the body. These findings could be used to develop new antiviral treatments that target this cellular process, both for COVID-19 and other similar diseases, the researchers said in a press release.
    • Limitations of prior immunity to COVID-19: One more recent paper that caught my attention: researchers at the University of Geneva in Switzerland studied how prior infection and/or vaccination can impact COVID-19 risk, based on about 50,000 cases and associated contact tracing data from the city of Geneva. The researchers found that both a recent infection and vaccination reduced the risk of getting infected from a close contact sick with COVID-19. But both types of immunity faded within a few months, leading people to remain vulnerable in the long-term. This study suggests that vaccines alone are not sufficient to control the spread of COVID-19; masks, ventilation improvements, and other interventions are needed, the authors argue.
    • NIH tests universal flu vaccine: Speaking of vaccines: the National Institute of Allergy and Infectious Diseases (or NIAID, one of the National Institutes of Health) announced this week that it’s starting a new trial for a universal flu vaccine. This vaccine, developed by NIAID researchers, can prompt the body to make antibodies against a wide variety of flu strains rather than focusing on one variant. The vaccine has done well in animal studies and is now ready for a phase one clinical trial. NIAID plans to test the vaccine in 24 volunteers, and will follow them closely through immune system testing to see how the vaccine performs.

  • National numbers, September 17

    National numbers, September 17

    Wastewater data from Biobot suggest that coronavirus levels in the U.S. right now are similar to this time in 2021, during the Delta surge.

    During the most recent week of data available (August 27-September 2), the U.S. reported about 18,900 new COVID-19 patients admitted to hospitals, according to the CDC. This amounts to:

    • An average of 2,700 new admissions each day
    • 5.7 total admissions for every 100,000 Americans
    • 9% more new admissions than the prior week (August 20-26)

    Additionally, the U.S. reported:

    • 14.4% of tests in the CDC’s surveillance network came back positive
    • A 10% lower concentration of SARS-CoV-2 in wastewater than last week (as of September 6, per Biobot’s dashboard)
    • 25% of new cases are caused by Omicron EG.5, 24% by XBB.1.6, 14% by FL.1.5.1 (as of September 16)

    For the second week in a row, available data suggest that the current COVID-19 surge may be turning around, or at least heading for a plateau. But there’s still a lot of coronavirus going around—and this will likely remain true through the winter respiratory virus season.

    Wastewater data from both Biobot Analytics and WastewaterSCAN suggest that coronavirus spread may be ticking down, after two months of increases. Biobot’s national trends show a 10% decline in SARS-CoV-2 levels in wastewater last week, after a 1% decline the week prior. WastewaterSCAN’s trends show a slow decline in the last week, following a slow increase over the summer.

    This decline isn’t universal across the country: according to Biobot’s regional data, the South and Northeast are reporting clearer declines in coronavirus spread, while the West is in a plateau and the Midwest is in an increase. Sewersheds in Midwestern cities like South Bend, Indiana, Coralville, Iowa, and Lincoln, Nebraska have reported major increases in SARS-CoV-2 levels in the last couple of weeks, per WastewaterSCAN.

    Test positivity data from the CDC’s respiratory virus testing network also suggest that this summer’s COVID-19 surge may be leveling off. About 14.3% of COVID-19 tests in this CDC network came back positive in the week ending September 9, compared to 14.4% and 14.6% in the prior two weeks. (Note: this network includes a sample of testing labs across the country, but is less comprehensive than our testing data were before the federal health emergency’s end.)

    Walgreens’ COVID-19 dashboard, which reports test positivity data from the pharmacy chain, shows the positivity rate leveling off as well. The share of Walgreens tests coming back positive went down slightly from 45% in late August to 40% this past week. Walgreens’ dashboard, like the wastewater data, shows that more people are testing positive in the Midwest and West regions.

    Hospitalizations for COVID-19 continue to trend up, with the CDC reporting about 2,700 new patients a day during the week ending September 2. While this number may seem small compared to the overwhelmed hospitals we saw in past surges, it’s important to remember that CDC hospitalization data are both delayed and incomplete.

    Our most recent data are from two weeks ago, and reporting standards for hospitals are more lenient now than they have been earlier in the pandemic—though the CDC does still collect data directly from facilities across the country.

    Variant estimates, also from the CDC, suggest that EG.5 and XBB.1.6 are still the dominant lineages in the U.S. Each accounted for about one in four COVID-19 cases in the last two weeks, while other versions of XBB caused the rest. BA.2.86 hasn’t appeared in the CDC’s prevalence estimates yet, but scientists have detected it in several states, suggesting it could be spreading under the radar.

    Biobot’s wastewater data suggest that COVID-19 spread in the U.S. is similar now to this time in 2021, during the Delta surge. If 2023 continues to follow trends from the last two years, we could see transmission plateau in early fall, then rise again during the holiday season.  Any lull that we do experience may be a good time to stock up on masks, rapid tests, and other tools to protect yourself and your community.

  • COVID source shout-out: Wastewater surveillance in Wyoming

    Wastewater surveillance is re-starting in some Wyoming sewersheds after an earlier iteration of the program ended in December 2021, according to local news reports. This monitoring is a good sign for expanded coverage across more rural parts of the U.S.

    Researchers at the University of Wyoming, working with the state health department, first started testing wastewater for SARS-CoV-2 in fall 2020. The program included about 50 testing sites across the state, according to public data shared by the researchers online.

    In December 2021, however, the testing program ran out of funding and had to scale back. The CDC’s wastewater dashboard includes just four sites in Wyoming that have reported to the National Wastewater Surveillance System in 2023. Data from these sites also appear on the Biobot dashboard, suggesting that they’re being monitored by the company in partnership with local health agencies.

    Now, the state’s surveillance program is getting renewed funding, according to a report by Caitlin Tan for Wyoming Public Radio. Tan writes that “some of the larger communities in Wyoming” will soon be testing their wastewater for the coronavirus and other viruses. Data will be posted by the CDC, and the surveillance will continue through at least July 2024, Tan reports.

    While the article doesn’t specify how many sites will participate, this is still good news for a state that’s had limited wastewater monitoring over the last two years. I hope to see other more rural states follow Wyoming’s lead.

  • National numbers, September 10

    National numbers, September 10

    COVID-19 test positivity and viral levels in wastewater may be turning around, but hospitalizations are still going up. Chart from the CDC, data as of September 7.

    During the most recent week of data available (August 20-26), the U.S. reported about 17,400 new COVID-19 patients admitted to hospitals, according to the CDC. This amounts to:

    • An average of 2,500 new admissions each day
    • 5.3 total admissions for every 100,000 Americans
    • 16% more new admissions than the prior week (August 13-19)

    Additionally, the U.S. reported:

    • 13.5% of tests in the CDC’s surveillance network came back positive
    • A 0.3% higher concentration of SARS-CoV-2 in wastewater than last week (as of September 6, per Biobot’s dashboard)
    • 23% of new cases are caused by Omicron XBB.1.6; 22% by EG.5; 15% by FL.1.5.1 (as of September 2)

    After two months of consistent increases in major COVID-19 metrics, we have once again reached, “Has the surge peaked?” territory. Preliminary data from wastewater and testing are suggesting potential plateaus, while more people are still getting hospitalized with COVID-19.

    National trends from Biobot Analytics’ wastewater surveillance network show very similar coronavirus levels in sewage this week and last week: 641 virus copies per milliliter of sewage on September 6, compared to 639 on August 30. These data are preliminary, though, and could change as more sewersheds report.

    Biobot’s regional data suggest different trends in different parts of the country: the South and West coast might be turning around, the Northeast is still reporting an increase (but the speed of increase there is slowing), and the Midwest is reporting a sharp increase following a recent decrease.

    Data from the CDC network and WastewaterSCAN similarly show mixed results depending on your location. Among CDC sites with recent data, about half reported increased coronavirus in their wastewater in the last two weeks, while the other half reported decreases. WastewaterSCAN’s network reports continued increases in Midwestern states, including sewersheds in Michigan, Ohio, and Kansas.

    Test positivity data from the CDC’s respiratory surveillance network also indicate that the summer surge might have peaked, or at least might be slowing. For the first time in several weeks, test positivity decreased slightly in the most recent CDC update, from 14.1% in the week ending August 26 to 13.5% in the week ending September 2.

    Walgreens’ COVID-19 positivity tracker (which shares data from tests conducted by the pharmacy network) reported a slight decrease as well, from 43.6% in the week ending August 26 to 40.6% in the week ending September 2. Like the wastewater surveillance data, this information is preliminary but could be a good sign.

    Meanwhile, COVID-19 hospitalizations—a more delayed metric—are still increasing. About 2,500 people were newly hospitalized with COVID-19 each day in the week ending August 26. Hospitalizations have particularly gone up for older adults, according to data from insurance company Humana shared with STAT News.

    Many students went back to school last week, as the fall semester gets underway. This could be another driver of COVID-19 spread, as travel and gatherings were in the summer. Better air quality, masks, and other measures could make schools safer for students, teachers, staff, and their families.

  • Wastewater surveillance is crucial for tracking new variants, BA.2.86 shows us

    Wastewater surveillance is crucial for tracking new variants, BA.2.86 shows us

    The CDC publishes data from about 400 wastewater testing sites that are sequencing their samples. Chart shows data from the week of August 17.

    This week, the health department in New York City, where I live, announced that they’d identified new variant BA.2.86 in the city’s wastewater. (For more details about BA.2.86, see last week’s Q&A post.)

    I covered the news for local outlet Gothamist/WNYC, and the story got me thinking about how important wastewater surveillance has become for tracking variants. With less clinical testing, sewage is now a crucial source for understanding how the coronavirus is mutating and what impacts those mutations have. But there are continued barriers to obtaining and interpreting wastewater data.

    Quoting from the story:

    The declaration of the end of the public health emergency in May made COVID-19 tests less available in health care settings, and sewage monitoring has since emerged as an important way to identify new variants.

    “As the wastewater testing has gotten better, the patient surveillance has decreased,” [said Marc Johnson, a virologist at the University of Missouri]. Several variants have been found in sewage before cases were confirmed, he said.

    That list now includes BA.2.86, in New York City as well as Ohio and other countries. The CDC publishes variant data from about 400 wastewater testing sites, including the city’s.

    But wastewater data from New York City is reported unevenly, with significant delays between when samples are collected and when data is published on dashboards run by the CDC and New York state.

    Wastewater surveillance has some distinct advantages, when it comes to variant monitoring:

    • It covers thousands of people—the entire population of a sewershed—with one sample. In big cities like NYC, one sample can include data from more than one million residents.
    • Through sewage samples, scientists can look for multiple variants at once, rather than compiling data over many PCR test results. They can also track population-level trends over time.
    • Unlike traditional case data, wastewater data don’t rely on how many people are getting tested or where. This lack of testing bias is important, as people typically use rapid tests—which are not reported to health systems—over PCR these days (rapid tests are easier to access, PCR sites have closed following the end of the federal public health emergency, etc.).

    But there are also some problems, as the NYC detection this week demonstrated:

    • Public health officials are still getting used to using and sharing wastewater data, as this is a relatively novel source with novel pipelines for transmitting data. While the CDC and other organizations are working to compile these data in a standardized way, it’s still a work in progress.
    • Discrepancies and delays can sometimes occur as a result. For example, in New York, the governor’s office put out a press release on Tuesday morning claiming that BA.2.86 hadn’t been detected in the state yet—then, just hours later, the city health department announced they’d found it. State health officials weren’t aware of the detection before the city made its public announcement, I learned for my news story.
    • Health officials are also still learning how to interpret and act on wastewater data. The NYC health department failed to answer my questions about in which sewershed or from which sampling date they found BA.2.86; it’s unclear if they’re using the detection to take any specific actions, besides simply warning the public that this variant is present.
    • As wastewater surveillance captures such broad samples, it’s difficult to tie new variant detections to clinical data, such as whether an infected person went to the hospital due to their symptoms. Officials can’t contact trace from these detections, making it hard to answer questions like whether BA.2.86 causes more severe symptoms.

    For more reading on this topic, I recommend my feature for Gothamist/WNYC and MuckRock last fall about NYC’s wastewater surveillance program, as well as other past posts at the COVID-19 Data Dispatch.

    More about wastewater surveillance

  • National numbers, September 3

    National numbers, September 3

    COVID-19 data from WastewaterSCAN suggest that coronavirus spread is still trending up nationwide.

    During the most recent week of data available (August 13-19), the U.S. reported about 15,100 new COVID-19 patients admitted to hospitals, according to the CDC. This amounts to:

    • An average of 2,200 new admissions each day
    • 4.6 total admissions for every 100,000 Americans
    • 19% more new admissions than the prior week (August 6-12)

    Additionally, the U.S. reported:

    • 14.9% of tests in the CDC’s surveillance network came back positive
    • A 3% higher concentration of SARS-CoV-2 in wastewater than last week (as of August 30, per Biobot’s dashboard)
    • 23% of new cases are caused by Omicron XBB.1.6; 22% by EG.5; 15% by FL.1.5.1 (as of September 2)

    The late-summer COVID-19 surge is still in full swing, with all major metrics showing further increases in disease spread this week. BA.2.86 isn’t spreading widely yet but is worth continued surveillance.

    Last week, I wrote that wastewater data from Biobot Analytics showed a potential plateau—but cautioned those data were tentative. Unfortunately, further updates this week suggest that COVID-19 transmission is still increasing, albeit not as dramatically as it was in July.

    Data from WastewaterSCAN show a similar pattern: a sharp increase in COVID-19 spread from late June through July, followed by a slight leveling off, and then followed by further increase. This could be caused by a newer variant entering the picture, driven by behaviors, or (most likely) some combination of the two.

    Regional data from both Biobot and WastewaterSCAN indicate that COVID-19 transmission might be approaching plateaus in the South and Midwest, but is going up sharply in the Northeast and West coast. The Midwest, after showing decreases in Biobot’s data over recent weeks, is now trending up again.

    The CDC’s test positivity and hospitalization numbers continue to rise as well. New hospital admissions for COVID-19 reached 2,000 per day during the week ending August 19, and are likely still higher now. Test positivity is up to 15%, the highest this metric has been since last winter’s holiday surge.

    In the CDC’s latest variant estimates (posted on Saturday), EG.5 and XBB.1.6 continue to dominate in a crowded landscape of Omicron XBB relatives. The agency hasn’t yet found enough BA.2.86 for this new variant to be included in the update. However, this could indicate low testing rather than an actual low prevalence of BA.2.86.

    The CDC often takes COVID-19 reporting breaks over holiday weekends, and this one is no exception: the agency will not update its dashboard on Monday, according to a note posted at the top of the page. Hospitalizations, test positivity, and other metrics will be updated later in the week.

    Of course, the coronavirus doesn’t care about holidays—in fact, it usually spreads more widely when people travel and gather. Fully understanding this Labor Day weekend’s impact could take several weeks, at our current pace of data reporting.

  • National numbers, August 27

    National numbers, August 27

    Biobot’s wastewater surveillance data suggest a potential plateau in COVID-19 spread, though future weeks of data will be needed to say for sure.

    During the most recent week of data available (August 6-12), the U.S. reported about 12,600 new COVID-19 patients admitted to hospitals, according to the CDC. This amounts to:

    • An average of 1,800 new admissions each day
    • 3.8 total admissions for every 100,000 Americans
    • 22% more new admissions than the prior week (July 30-August 5)

    Additionally, the U.S. reported:

    • 13.4% of tests in the CDC’s surveillance network came back positive
    • A 1% lower concentration of SARS-CoV-2 in wastewater than last week (as of August 23, per Biobot’s dashboard)
    • 25% of new cases are caused by Omicron XBB.1.6; 21% by EG.5; 11% by XBB.2.3; 13% by FL.1.5.1 (as of August 19)

    This week, our limited COVID-19 data picture suggests that transmission may be starting to level off. But if BA.2.86 or another newer variant enters this high-spread environment, the outlook could get less rosy.

    One sign of a possible plateau: Biobot’s national wastewater surveillance dashboard shows a very slight downward trend, with SARS-CoV-2 levels dropping by about 1% from August 16 to August 23. This is based on just one week of data, though, so we’ll have to see what further updates show.

    Biobot’s regional data similarly show potential good trends: the Midwest appears to have passed the peak during this surge, as of the last two weeks, while the South and Northeast also show slight plateaus. Coronavirus levels are still trending up in the West, but less intensely.

    Data from both Biobot and WastewaterSCAN suggest that COVID-19 spread has turned a corner in some Midwest sewersheds, such as Johnson County, Kansas; Lawrence, Kansas; Lonoke County, Arkansas; Lincoln, Nebraska; and Warren, Michigan. Still, more data are needed to see if these trends hold.

    Test positivity data from the CDC’s respiratory surveillance network also suggest that COVID-19 spread may be slowing. After a rapid rise through July, test positivity increased by just 8% in the most recent week of data (ending August 19), from 12.4% to 13.4%. This is still a high overall positivity rate, though, especially considering how difficult PCR tests are to access these days.

    Hospitalizations continue to rise as well: the CDC reported a 22% increase in new COVID-19 patients from the week ending August 5 to the week ending August 12. While hospitalizations are significantly delayed compared to other metrics, these data show one of the surge’s severe impacts. We have even less data about Long COVID, the other main severe impact.

    BA.2.86, a new variant that scientists are watching closely, isn’t yet impacting transmission in the U.S. based on our current data. But it could lead to another increase in cases, if it proves able to outcompete the now-dominant group of XBB variants. (More on BA.2.86 later in today’s issue.)

    Remember: new variants don’t appear magically out of nowhere. People encourage their evolution, by allowing the virus to continue spreading unchecked. In addition to protecting ourselves and our communities, COVID-19 safety measures help to prevent further mutation.

  • COVID source callout: Nebraska stops reporting wastewater data

    The Nebraska state health department has discontinued its wastewater surveillance data page, depriving residents of important COVID-19 updates at a time when cases are rising.

    Multiple local news outlets in the state (including the Omaha World-Herald, the Lincoln Journal-Star, and the radio station KIOS) reported the removal. Nebraska’s health department previously shared wastewater updates through PDF reports, published every two weeks; these reports included recent COVID-19 trends along with data about variants sequenced in the state’s sewage.

    Now, the health department’s wastewater surveillance page redirects to an error message, reading: “This page is currently unavailable.” The change came as wastewater data in Nebraska and across the country were showing an increase in coronavirus spread, local reporters covering the story have pointed out.

    Nebraska’s health department discontinued this webpage due to the federal public health emergency’s end in May, a spokesperson for the agency told the World-Herald and Journal-Star. The agency is still tracking wastewater data, the spokesperson said. But it’s apparently redesigning its public website to include as little information as possible.

    “Data continues to be tracked for that program and is available upon request,” the agency spokesperson told local reporters. Nebraska’s wastewater data still appear to be available on the CDC’s dashboard, as well. But new data for Nebraska sites were most recently added to that dashboard in early August, so it’s unclear whether CDC updates will continue after the local page’s end.

    Even if the Nebraska health department does continue sending data to the CDC, the national dashboard is less accessible to residents hoping to keep track of COVID-19 trends than the state’s reports were. As I’ve written before, local dashboards and alert systems are always better when it comes to tailoring updates for a specific community.