Tag: Thanksgiving

  • National numbers, December 12

    National numbers, December 12

    All major COVID-19 metrics shot up in the U.S. this week. Chart from the December 9 HHS Community Profile Report.

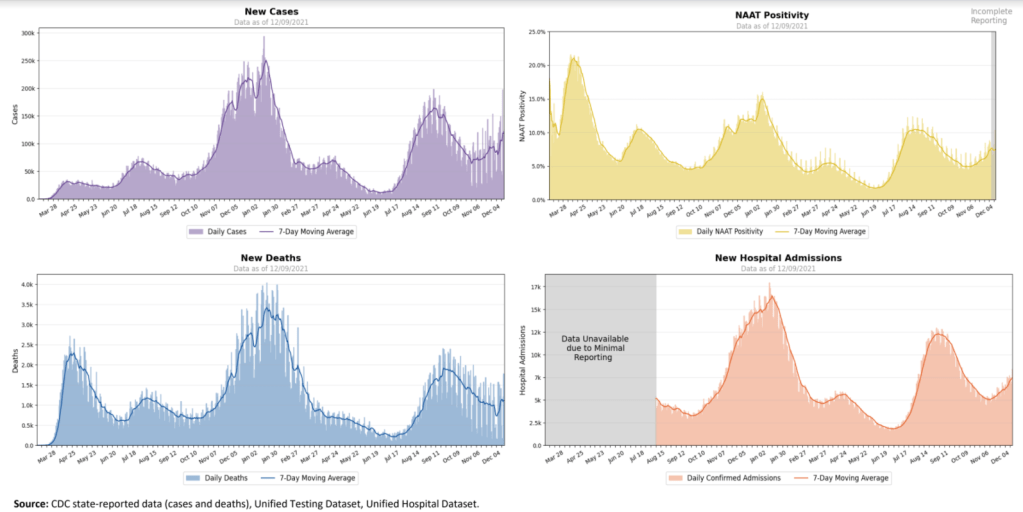
    In the past week (December 4 through 10), the U.S. reported about 830,000 new cases, according to the CDC. This amounts to:

    • An average of 119,000 new cases each day
    • 253 total new cases for every 100,000 Americans
    • 37% more new cases than last week (November 27-December 3)

    Last week, America also saw:

    • 52,000 new COVID-19 patients admitted to hospitals (16 for every 100,000 people)
    • 7,600 new COVID-19 deaths (2.3 for every 100,000 people)
    • 99.9% of new cases are Delta-caused (as of December 4)
    • An average of 2.3 million vaccinations per day (including booster shots; per Bloomberg)

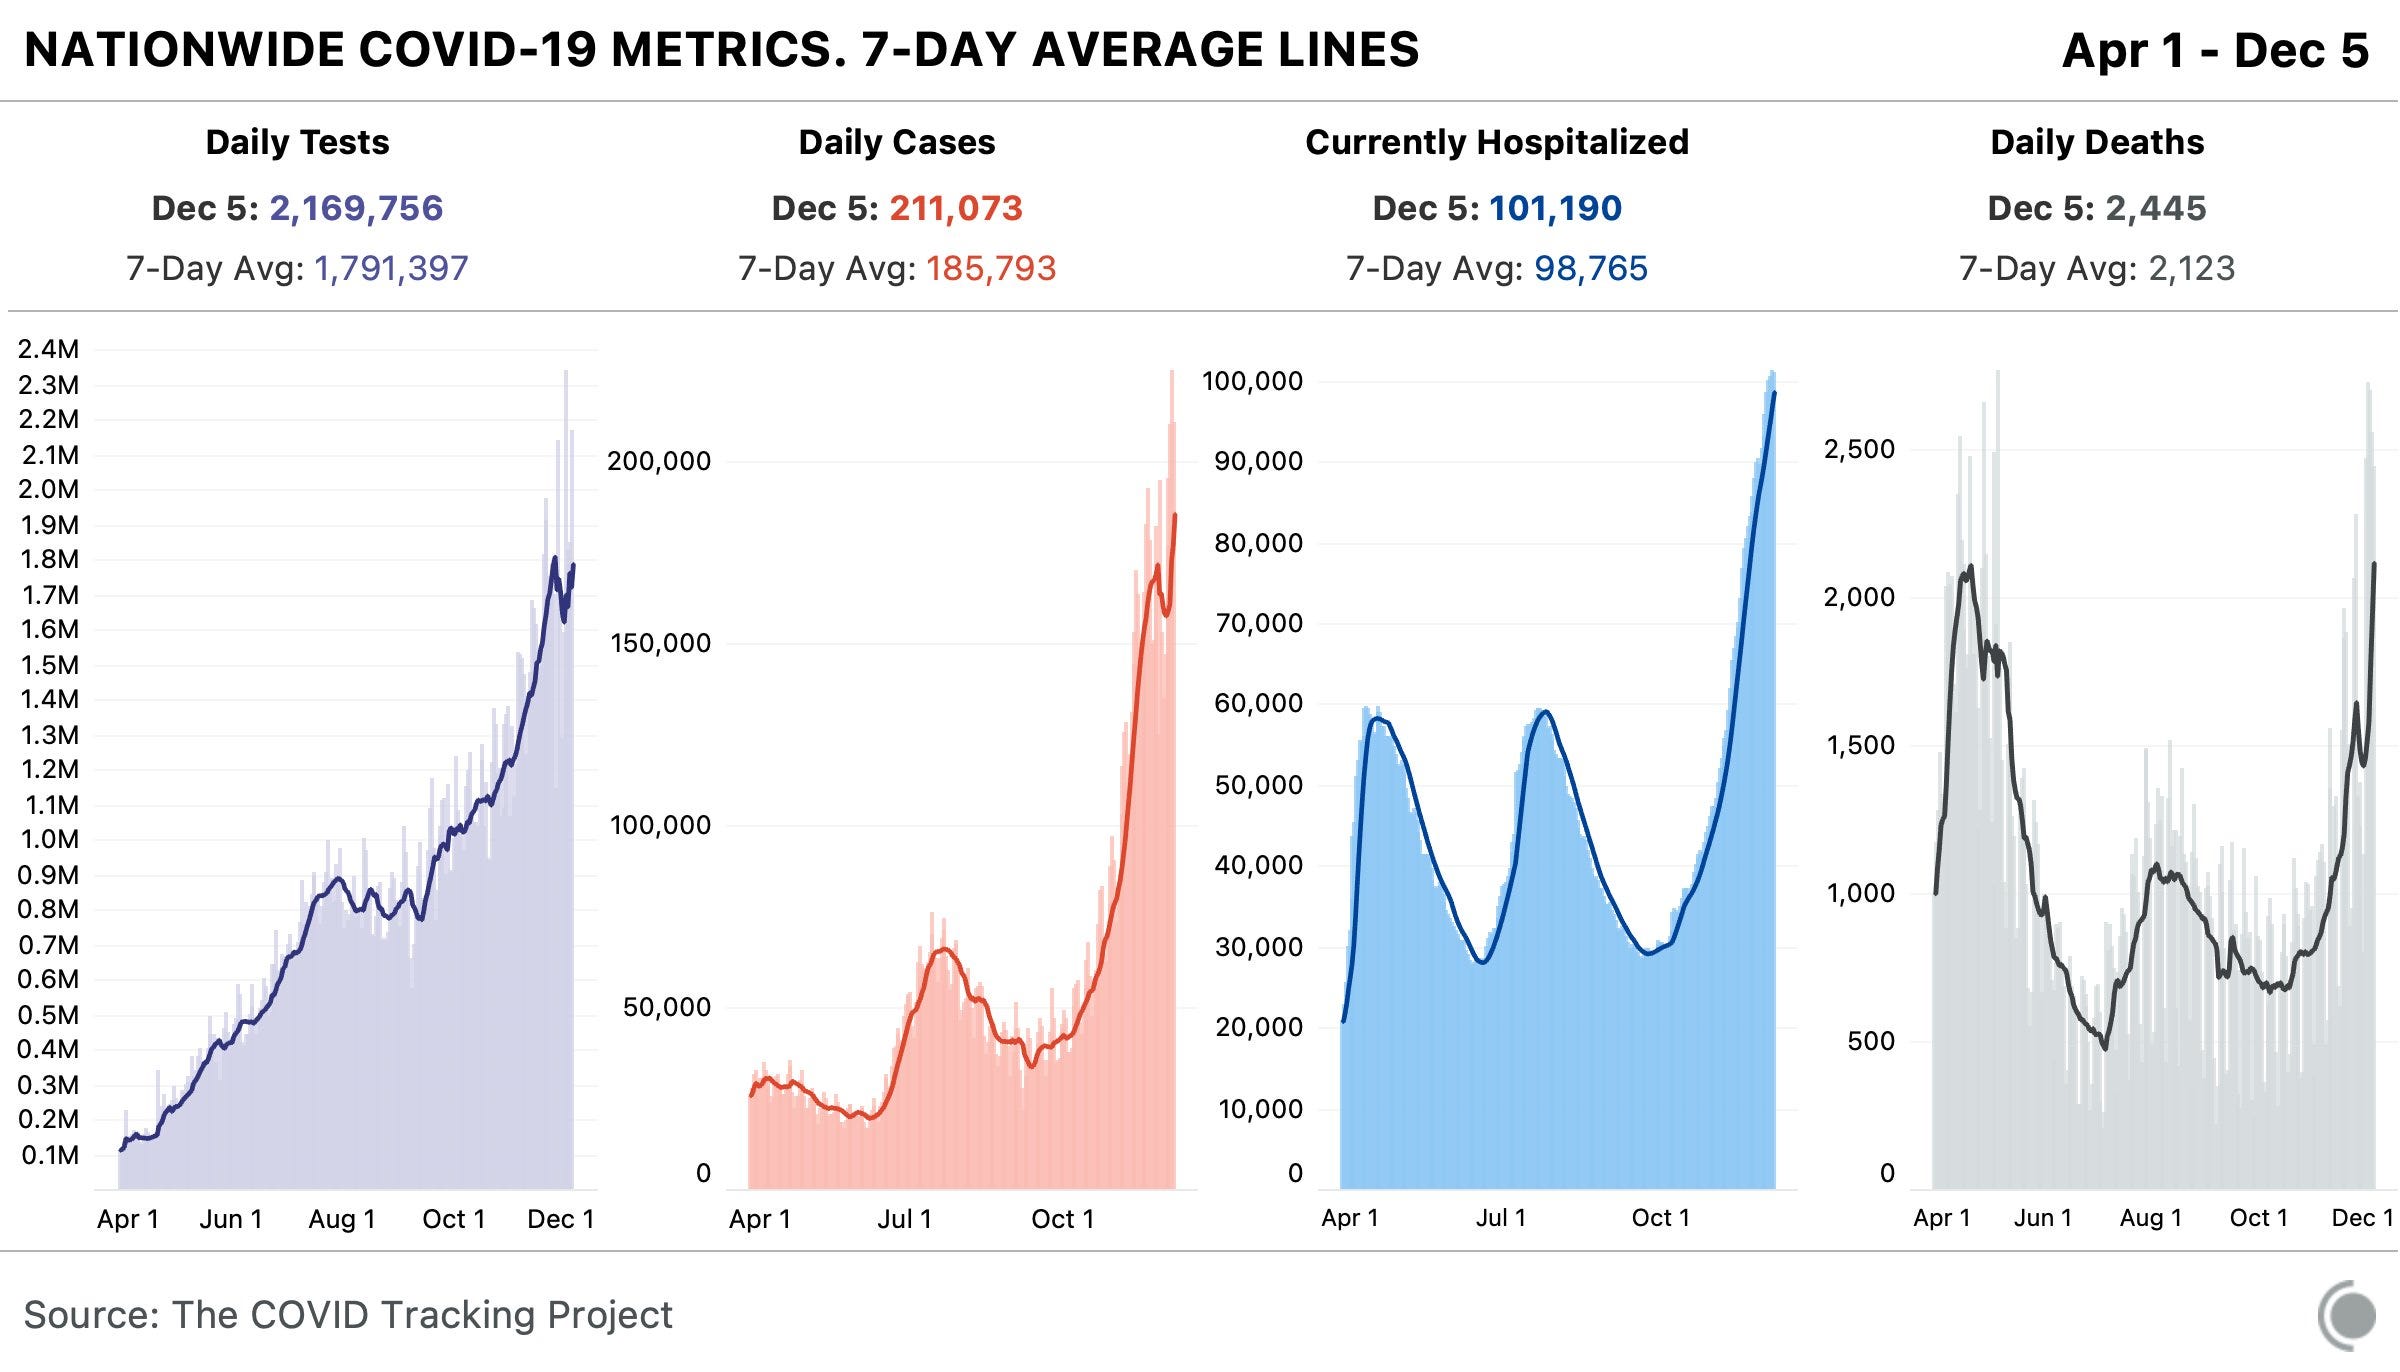
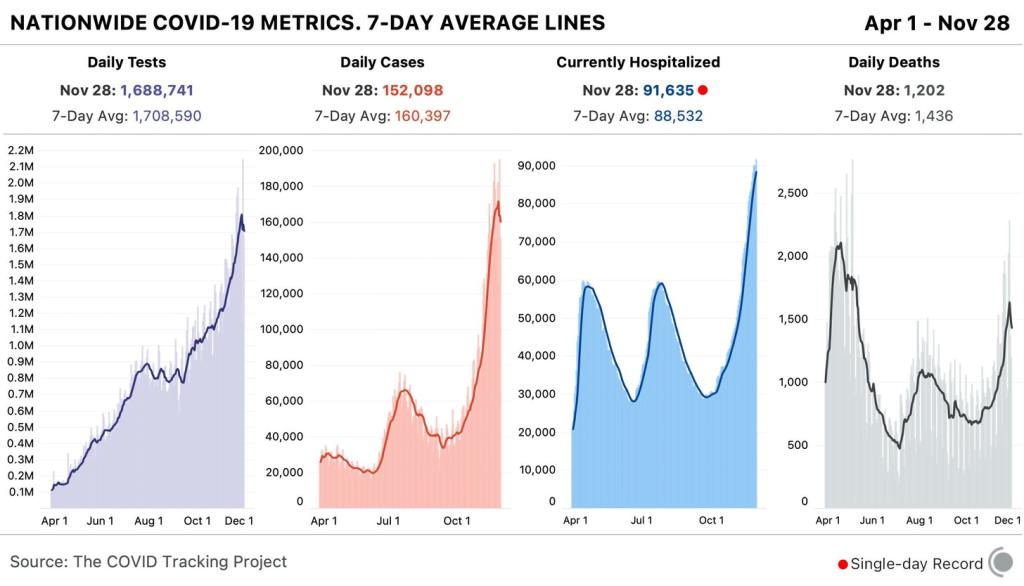
    Remember how, last week, I said that the dip in the CDC’s case counts was a vestige of Thanksgiving data delays—and we’d see more cases in the next week? Well, we’re seeing those cases now. Cases have increased by 37% from last week to this week, and they’ve increased by 55% in the last month.

    Hospitalizations are also going up: the number of new COVID-19 patients admitted to hospitals each day has risen 16%, to over 7,000. About 56,000 people are currently hospitalized with COVID-19 in the U.S., as of Thursday. And, tragically, death counts are rising as well: once again, over 1,000 Americans are dying from COVID-19 every day.

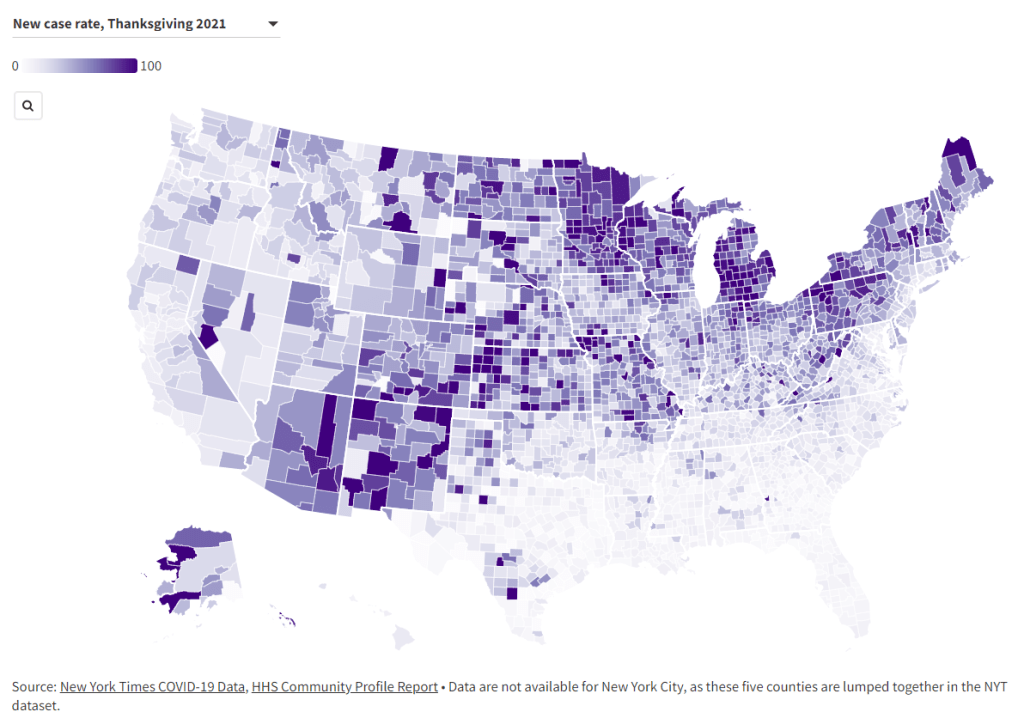
    Current hotspots include states in the Northeast and Midwest. New Hampshire reported the most cases per capita last week, at 659 new cases for every 100,000 people, per the latest Community Profile Report. Michigan, Minnesota, Rhode Island, and New Mexico also all reported over 500 new cases for every 100,000 people.

    In many parts of the country, COVID-19 patients have once again pushed hospitals to their breaking points, as the pandemic intersects with staff shortages and burnout as well as flu and other conditions. “We’re at capacity on a daily basis,” the president of a hospital system in Detroit told a local reporter.

    Despite growing Omicron concerns (more on that later), the Delta variant is clearly driving this surge. According to the CDC’s estimates, the Delta variant has caused more than 99% of cases in the week ending December 4, while Omicron has yet to cause even 0.1%. If Omicron is able to outcompete Delta in the U.S., the situation could become even more dire.

    It’s now been two years since a COVID-19 patient first sought medical attention, at a hospital in Wuhan, China. Though most Americans didn’t become aware of the pandemic until March 2020, the coronavirus was already spreading in December 2019—meaning that now, in December 2021, we’re entering Year Three of this global crisis. I hope this can be the year that we get vaccines to every country in the world, and truly get the virus under control.

  • Cases are rising on Thanksgiving again, but we’re better protected this year

    Cases are rising on Thanksgiving again, but we’re better protected this year

    Before the Omicron news hit on Thursday, I was planning to write a big post about how the state of the pandemic in the U.S. at Thanksgiving this year compares to the state of the pandemic at Thanksgiving last year. But, well, Omicron happened—so here’s a small post about Thanksgiving, instead.

    Remember: last year, Thanksgiving was a turning point in the winter 2020 surge. While cases had already been going up prior to the holiday, the convergence of travel, indoor gatherings, and cold weather helped the coronavirus spread further. Christmas did the same thing, one month later.

    This year, we saw cases increase once again in the weeks prior to Thanksgiving. But we’re better protected this time, thanks to vaccines and better knowledge of the virus.

    Let’s look at the national metrics:

    • On November 23, 2021 (two days before Thanksgiving), the seven-day average of new COVID-19 cases was about 94,000 new cases a day. That’s about 45% lower than last year’s number, 170,000 new cases a day (on November 26, 2020, Thanksgiving itself).
    • On November 23, 2021, the seven-day average of new COVID-19 deaths was about 1,000 new deaths a day. That’s about 45% lower than last year’s number, 1,800 new deaths a day.
    • On November 25, 2021 (Thanksgiving day), 43,000 people were hospitalized with COVID-19 in facilities across the U.S. That’s just under half as many as the number of patients hospitalized last year, 84,000 people.
    • As of November 24, 2021, 196 million Americans are fully vaccinated against COVID-19—and an additional 35 million have received at least one dose, while more than 37 million have received booster shots.

    Clearly, while the trajectory of cases (and other metrics) may be the same as they were last year, the numbers are way lower. But the national metrics obscure local patterns. In some parts of the country, particularly some northern states, case numbers are actually higher at Thanksgiving this year than they were last year. 

    You can see how your county is faring on this map, which I put together for a DailyMail.com story on this topic. Use the drop-down menu at the top to click between Thanksgiving 2020 and Thanksgiving 2021.

    For that DailyMail.com story, I asked several COVID-19 experts for their thoughts on this winter’s oncoming surge, as well as their advice for staying safe while gathering for the holidays. Key pieces of advice included:

    • Get vaccinated, including a booster shot if you’re eligible.
    • Get tested prior to travel or large gatherings.
    • Use high-quality masks (especially N95s and KN95s) while traveling.
    • Be aware of case rates at both your point of origin and your destination.
    • If you’re gathering indoors with others, make sure everyone is on the same page about safety.

  • National numbers, November 28

    National numbers, November 28

    Community transmission levels by state, as of November 24. Florida is the only state with “moderate” transmission, while several other Southern states have “substantial” transmission. Chart via the CDC.

    In the past week (November 18 through 24), the U.S. reported about 660,000 new cases, according to the CDC.* This amounts to:

    • An average of 94,000 new cases each day
    • 201 total new cases for every 100,000 Americans

    Last week, America also saw:

    • 41,000 new COVID-19 patients admitted to hospitals (12 for every 100,000 people)
    • 6,900 new COVID-19 deaths (2.1 for every 100,000 people)
    • 100% of new cases are Delta-caused (as of November 20)
    • An average of 1.8 million vaccinations per day (including booster shots; per Bloomberg)

    *Note: This week, the CDC did not provide COVID-19 data updates for most metrics on Thursday, Friday, or Saturday due to the holiday, so my update is based on Wednesday’s data.

    As is typically the case on holidays, Thanksgiving has made COVID-19 reporting a bit wonky. The CDC didn’t update its dashboard at all from Thursday through Saturday, and it is not updating vaccination data all weekend. At the same time, public health workers at many state and local agencies are taking a well-deserved long weekend off—leading to delayed reports of cases that will show up in the next couple of weeks. 

    Still, cases seem to continue trending up at the national level. The U.S. is now reporting close to 100,000 new cases a day, and holiday travel is likely to push this number up further. Michigan, Minnesota, and New Hampshire are the country’s three biggest hotspots, per the latest Community Profile Report (released Wednesday), all with over 500 total new cases per 100,000 people in the past week.

    Other Northern states—Wisconsin, Maine, Colorado, Vermont—are also reporting high case rates, while Southern states continue to see lower numbers. Florida actually has the lowest case rate in the country, at 49 new cases per 100,000 people in the past week. This state is likely benefitting from COVID-19’s seasonal nature, combined with a lot of built-up immunity from the region’s summer Delta surge.

    Nationally, the number of COVID-19 deaths in the U.S. in 2021 has surpassed the total deaths from the virus in 2020. Even though vaccines have been widely available for most of this year. The 2020 number is likely a significant undercount, as many people who contracted the coronavirus in spring 2020 were unable to get tested—but still, this milestone is disheartening.

    Vaccination numbers have increased dramatically in the U.S. in recent weeks with well over one million shots given a day, thanks to booster shot availability and new eligibility for children under age 12. About 38 million people have now received their third doses, according to the CDC. But whether this will be enough to blunt the coming winter surge remains to be seen.

  • National numbers, Dec. 6

    National numbers, Dec. 6

    In the past week (November 29 through December 5), the U.S. reported about 1.3 million new cases, according to the COVID Tracking Project. This amounts to:

    • An average of 186,000 new cases each day (16% increase from the previous week)
    • 297 total new cases for every 100,000 Americans
    • 1 in 252 Americans getting diagnosed with COVID-19 in the past week
    • 9% of the total cases the U.S. reported in the full course of the pandemic
    Chart of tests, cases, current hospitalizations, and deaths nationwide.
    Nationwide COVID-19 metrics published in the COVID Tracking Project’s daily update on December 5. The seven-day average for reported COVID-19 deaths is at an all-time high.

    More Americans are getting sick with COVID-19 now than ever before in the pandemic. And this outbreak isn’t isolated. Eleven states broke case records on Thursday, for example, including states in all major regions of the country.

    Last week, I warned you about data fluctuations which I expected to see thanks to the Thanksgiving holiday. America first reported fewer cases, deaths, and tests, as public health workers took a day or two off and data pipelines were interrupted. Then, the cases which were not reported over the holiday were added to the count belatedly, culminating in a record of 225,000 new cases on Friday.

    If you visit the COVID Tracking Project’s website, you’ll still see a warning notice about these Thanksgiving data disruptions. However, one key number tells us that the pandemic is, in fact, still getting more dire: more patients are getting admitted to the hospital than ever before.

    Last week, America saw:

    • Over 100,000 people now hospitalized with COVID-19 (it’s 101,200 as of yesterday, twice the number of patients at the beginning of November)
    • 15,000 new COVID-19 deaths (5 for every 100,000 people)

    To understand the impact of that hospitalization record, read Alexis Madrigal and Rob Meyer in The Atlantic:

    Many states have reported that their hospitals are running out of room and restricting which patients can be admitted. In South Dakota, a network of 37 hospitals reported sending more than 150 people home with oxygen tanks to keep beds open for even sicker patients. A hospital in Amarillo, Texas, reported that COVID-19 patients are waiting in the emergency room for beds to become available. Some patients in Laredo, Texas, were sent to hospitals in San Antonio—until that city stopped accepting transfers. Elsewhere in Texas, patients were sent to Oklahoma, but hospitals there have also tightened their admission criteria.

    Or, for one doctor’s perspective, read this thread from Dr. Esther Choo:

    Deaths are also rising. The deaths of 15,000 Americans were reported last week—the highest number of any week in the pandemic thus far. In fact, COVID-19 was the leading cause of death in America last week, according to the Institute for Health Metrics and Evaluation.

  • National numbers, Nov. 29

    National numbers, Nov. 29

    In the past week (November 22 through 28), the U.S. reported about 1.1 million new cases, according to the COVID Tracking Project. This amounts to:

    • An average of 160,000 new cases each day (4% decrease from the previous week)
    • 343 total new cases for every 100,000 Americans
    • 1 in 292 Americans getting diagnosed with COVID-19 in the past week
    • 9% of the total cases the U.S. reported in the full course of the pandemic
    Chart of tests, cases, current hospitalizations, and deaths nationwide. Current hospitalizations are a single-day record.
    Nationwide COVID-19 metrics published in the COVID Tracking Project’s daily update on November 21. While reported cases have fluctuated due to the Thanksgiving holiday (see below), hospitalizations continue to rise.

    1 in every 82 Americans has been diagnosed with COVID-19 since the beginning of November. Sit with that number for a minute. Picture 82 people. Imagine one of them getting sick, going to the hospital, having debilitating symptoms for months afterward. That is the weight of this pandemic on America right now.

    The COVID Exit Strategy tracker now categorizes the virus spread in every state except for Maine, Vermont, and Hawaii as “uncontrolled,” and even those three states are “trending poorly.” I know we just finished an exhaustive public health news cycle about Thanksgiving travel, but… I would recommend that you start making your Christmas plans now.

    America also saw:

    • 10,000 new COVID-19 deaths last week (3.1 per 100,000 people)
    • 91,600 people currently hospitalized with the disease, as of yesterday (93% increase from the start of November)

    This week, though, I need to caveat the data pretty heavily. The public health officials who collect and report COVID-19 numbers celebrate holidays just like the rest of us; but when dashboards go dark for a day or two, those data gaps can lead to some weird trends.

    Here’s how COVID Tracking Project lead Erin Kissane explains it, in a recent Project blog post:

    First, by Thanksgiving Day and perhaps as early as Wednesday, all three metrics [tests, cases, and deaths] will flatten out or drop, probably for several days. This decrease will make it look like things are getting better at the national level. Then, in the week following the holiday, our test, case, and death numbers will spike, which will look like a confirmation that Thanksgiving is causing outbreaks to worsen. But neither of these expected movements in the data will necessarily mean anything about the state of the pandemic itself. Holidays, like weekends, cause testing and reporting to go down and then, a few days later, to “catch up.” So the data we see early next week will reflect not only actual increases in cases, test, and deaths, but also the potentially very large backlog from the holiday.

    And indeed, new daily cases dropped from 183,000 on Wednesday to 125,000 on Thursday, rose to 194,000 on Friday, then dropped back to 152,000 on Saturday. Even in the states which still reported new cases, deaths, and tests on Thanksgiving, many testing sites and labs were closed, further contributing to reporting backlogs and discrepancies.

    If you’re watching (or reporting) the numbers in your community, the Project recommends using seven-day averages—for example, rather than just looking at today’s new cases for evidence that the pandemic is slowing, calculate the average of today’s new cases and new cases from the six previous days. Current hospitalization figures and the hospital capacity data reported by the Department of Health and Human Services (HHS) may also be more reliable, as hospitals don’t take days off.

    Finally, I’d like to echo the COVID Tracking Project in thanking the many thousands of people behind these data. There are healthcare workers, lab technicians, public health leaders, and data pipeline IT workers behind every single number that you see in this newsletter. I am grateful for all of their efforts.