Tag: Texas

  • Fenceline communities left behind by data gaps: A dispatch from SEJ in Houston

    Fenceline communities left behind by data gaps: A dispatch from SEJ in Houston

    This week, I’m sharing a short dispatch from the Society of Environmental Journalists (SEJ) conference in Houston, Texas. Unlike other journalism conferences I’ve attended, SEJ meetings don’t just sequester you in your hotel all day: the organizers plan field trips that are designed to give reporters on-the-ground information about environmental issues at the place they’re visiting.

    I went on one of these trips, to the Houston Ship Channel and surrounding communities impacted by industrial pollution. For me, this experience was a lesson in the cascading health issues caused by environmental racism—including, of course, COVID-19—as well as the ways that data gaps can make it harder for hard-hit communities to get needed public health assistance.

    The Houston Ship Channel, I learned this week, is a passage for ships going between Houston’s port and the Gulf of Mexico. According to the Port Houston website, it’s the largest container port in the Gulf Coast, handling about two-thirds of all shipping containers that travel through the region. (Shipping containers include all the consumer products that we order online.)

    It is also the single largest U.S. port for petroleum exports. Every month, thousands of tons of oil and plastics (which are made from oil) pass through the Houston Ship Channel; much of this cargo is processed right on the banks of the channel, in massive refineries that define the landscape around Houston.

    With SEJ, I went on a boat tour through the Houston Ship Channel. We passed refineries and industrial plants from Valero, Chevron, Exxon-Mobil, and other major companies, getting a close look at just how much space these facilities take up and how they decimate the surrounding land.

    After the boat, my group went to Manchester, a neighborhood close to the channel in southeast Houston. Community activists from the local environmental advocacy group TEJAS explained that this neighborhood’s population is overwhelmingly Latino; many residents are low-income workers with no college degrees who speak Spanish as their first language.

    Manchester residents have faced intense pollution from industrial plants that border their homes, schools, and community spaces. We walked through a park that is surrounded on multiple sides by these plants; we could see smoke from chemicals burning, and smell the results of that burning in the air. Valero, which owns one of the nearby plants, had recently sponsored a playground in this park as a small gesture, barely acknowledging the harm it’s caused to this neighborhood.

    Of course, my immediate question was: what are the COVID-19 statistics for this neighborhood? To me, it seemed obvious that Manchester residents living with this intense pollution would face higher rates of respiratory conditions, cancers, and other diseases that would make them more vulnerable to severe COVID-19 symptoms. (Poor quality air has been linked with more severe COVID-19 outcomes since the early days of the pandemic.)

    Here’s the problem: nobody could actually answer my question. I spoke to Leticia Ablaza, government relations director at Air Alliance Houston and another speaker on the tour, who explained that the link between pollution and COVID-19 in Manchester and other similar Houston neighborhoods has yet to be studied. Anecdotally, she said, she knows community members with respiratory conditions who have faced heightened vulnerability to COVID-19. But there’s no formal data.

    The reason for this lack of formal studies became clear to me later, when I attended a conference session on the links between COVID-19 and environmental health. Annie Xu, a Rice University student who has studied health disparities in Texas, said at this session that the state of Texas does not publish any COVID-19 data below the county level.

    Xu’s research group did identify links between Texas counties’ racial demographics and their COVID-19 burden, published in Nature Scientific Reports in January. But when the group looked for links between air pollution and COVID-19, the analysis didn’t lead to significant results.

    This finding is likely because pollution can vary widely within Texas counties, Xu said. For example, there’s a huge gap between air quality in Manchester and on Rice’s campus, both of which are included in Harris County. To truly find a connection between pollution and COVID-19, a research group like hers would require more granular data, such as at the ZIP code or census tract level.

    But the Texas public health department only publishes COVID-19 data at the county level—with the exception of vaccinations, one metric that is available by ZIP code. The federal government doesn’t report COVID-19 data below the county level either.

    Without this granular information, it’s difficult to demonstrate the impacts of petrochemical pollution on COVID-19 in neighborhoods like Manchester. The community isn’t able to get priority status for public health interventions like vaccines or testing—meaning that its vulnerabilities are unlikely to change.

    As longtime readers know, I have spent a lot of time grappling with COVID-19’s demographic disparities. I was a leading volunteer for the COVID Tracking Project’s COVID Racial Data Tracker, and have sought to call attention to the terrible state of this type of COVID-19 data in the U.S. whenever I can. Still, it was a new experience to actually see a community left behind by the data gaps that I cover.

    What kind of investment would be required to truly study how COVID-19 has impacted a place like Manchester, in Houston? And what other environment-related health conditions do we need to be investigating in these areas? I hope that future stories will enable me to answer these questions.

    For now, if you have any questions, comments, or data source recommendations in this area, please reach out!

  • Fall 2021 school reopening: Stats so far

    Fall 2021 school reopening: Stats so far

    Over 1,400 schools have closed temporarily thus far in fall 2021, according to data collected by Burbio. Screenshot taken on September 11.

    The COVID-19 Data Dispatch has, clearly, been pretty focused on school reopening in recent weeks. But our “Opening” project is primarily retrospective, looking back at schools that were successful last school year. This fall, the Delta variant and additional political pressures have made reopening success even harder to achieve.

    With some schools now over a month into the fall semester—while others, like those in NYC, are finally starting class next week—let’s talk about how reopening has gone thus far.  

    Many schools in high-transmission areas have closed temporarily. “More than 1,400 schools across 278 districts in 35 states that began the academic year in person have closed,” writes U.S. News reporter Lauren Camera, citing data from the tracking organization Burbio. Due to out-of-control COVID-19 outbreaks, some districts switched temporarily to remote learning while others fully closed or delayed the start of class.

    While that may seem striking, it’s just about 1.4% of the 98,000 public school districts in the U.S. And, as you can see from Burbio’s closure map, many of the districts that had to shut down are located in Southern states with limited COVID-19 safety protocols. In Texas, for example, over 70,000 K-12 students have tested positive for COVID-19 since the beginning of the fall semester, out of about 5.3 million total students. In the 2020-2021 school year, about 148,000 Texas students got COVID-19 in total. This is a pretty clear signifier of the increasing danger that Delta, combined with lower mask use in schools, may bring to classrooms.

    The school districts that closed include Scott County School District 1, the subject of our first “Opening” profile. This Indiana district originally opened in August 2021 with no mask requirement; cases quickly climbed, leading the district to shift to virtual instruction for two weeks. When students returned to classrooms in late August, masks were required once again.

    Schools with stricter COVID-19 precautions are faring better. Many of those school districts that start earlier in August are located in the South. From a news cycle perspective, that means we tend to hear about the schools that shut down due to outbreaks before we hear about the schools that aren’t seeing so much virus transmission.

    For example: this past Thursday, San Francisco’s local health department announced that the city has not seen a single case of transmission at a public school. School started on August 17, giving officials about one month of data for the district’s over 50,000 students. Safety precautions in San Francisco schools include required masking, surveillance testing, ventilation updates, and mandatory vaccination for teachers and staff. Dr. Naveena Bobba, from the city public health department, additionally said that about 90% of residents in the 12 to 17 age group are fully vaccinated.

    We’re starting to see vaccine mandates for students in addition to teachers and staff. Los Angeles Unified is now requiring vaccination for all eligible students, ages 12 and up. LA is the second-largest school district in the country, serving over 600,000 students—including 225,000 who are eligible for vaccination. The majority of those students are already vaccinated, according to the county public health department; the rest will have until October 31 to catch up.

    LA’s school district follows many colleges and universities that have required vaccination and Culver City Unified, another California district that announced a student mandate in late August. As vaccination rates in the 12-17 age group tend to be low and parent hesitation tends to be high, student vaccination mandates likely won’t be as common as staff mandates. But I wouldn’t be surprised if we see more districts make this requirement.

    Despite federal encouragement to provide regular COVID-19 testing, many schools aren’t doing it. The Biden administration “Path out of the Pandemic” plan focuses on COVID-19 testing, including a call for K-12 school districts to set up regular testing for unvaccinated students and staff. If all schools followed the CDC’s testing guidance, they’d be testing at least 10% of students, at least once a week. (This is, again, an area where many colleges and universities are already excelling.)

    School districts have had months to tap into $10 billion set aside specifically for school testing in the American Rescue Plan. But many districts are still not testing, or are offering tests only to students who show COVID-19 symptoms or were recently in contact with a case. The nation’s largest school district (New York City) has even loosened its testing protocol from last year—shifting from mandatory testing for 20% of students and staff every week, to non-mandatory testing for 10% of unvaccinated students every other week. Some parents and staff are not happy about the change, saying that NYC should be testing more, not less.

    The federal government is expanding school data collection, but still not counting cases. After Biden took office, the federal Department of Education started surveying schools on their pandemic protocols—asking whether schools were open online, in-person, or hybrid, how many students were choosing different options, and other similar questions. Survey data are made public on a federal dashboard, updated once a month; but the data are fairly incomplete, with numbers unavailable for about 20 states and all but ten individual districts.

    Now, the federal DOE is expanding its survey efforts “by asking more questions about how students learn and what precautions schools take,” according to EdWeek. But if the DOE doesn’t also expand its survey to more school districts and states, it’s unclear how useful these data will be. And the federal government still isn’t tracking the most important metric here: actual case counts in schools!

    While pediatric case counts soar, children are still at low risk for severe disease. As we see reports of record cases in children and overwhelmed pediatric ICUs, it is important to recognize that—tragic as these reports may be—the majority of kids who contract COVID-19 have mild cases.

    An article from the German news site Spektrum der Wissenschaft, republished in Scientific American, helps to explain how children’s immune systems work to recognize the novel coronavirus and stop the virus from causing severe disease:

    The immune system uses a special mechanism to protect children from novel viruses—and it typically saves them from a severe course of COVID-19 in two different ways. In the mucous membranes of their airways, it is much more active than that of adults. In children, this system reacts much faster to viruses that it has never encountered, such as pandemic pathogens. At least, that is what a recent study by Irina Lehmann of the Berlin Institute of Health at Charité and her colleagues suggests.

    As children get older, the article explains, immune system resources are shifted from this innate response to a memory-based response; adults are thus more protected against viruses that they’ve encountered before.


    Read the Opening series

  • Opening profile: Personal responsibility in Andrews, Texas

    Opening profile: Personal responsibility in Andrews, Texas

    By Betsy Ladyzhets

    Andrews County students gather at a football game in August 2021. Photo via the district’s Facebook page.

    On July 28, 2020, before the start of fall extracurriculars, Andrews Independent School District held a town hall in the high school auditorium. Parents and community members came from across the county to grill the district administrators on their reopening plans. While some parents wanted the details on safety measures, others were more concerned about their individual freedoms.

    Bobby Azam, the district superintendent, recalls parents asking questions like, “Are you going to force my child to sit still all day?” or “Are you going to penalize my child if their mask slips off?”

    Ultimately, when schools reopened for in-person classes, students in this West Texas district were not penalized for letting a mask slip. The school district prioritized personal responsibility, giving families information to make individual choices about their children’s safety. Partnerships with the local health department, outdoor classes, increased ventilation, and an intensive cleaning regimen also helped keep cases down — even though the district did not follow all Centers for Disease Control and Prevention (CDC) protocols, such as required quarantines and masks for the youngest students.

    Andrews County’s school district is the subject of the third profile in the COVID-19 Data Dispatch’s “Opening” series. Alongside four other school communities, we selected it because the majority of the district’s students returned to in-person learning during the 2020-2021 school year — and officials identified COVID-19 cases in under 5% of the student population. (According to the CDC, about 5% of school-aged children in the U.S. have contracted COVID-19 since the start of the pandemic.)

    Though this district did not adhere to the full extent of COVID-19 prevention guidance, it offers valuable lessons in addressing community politics while still maintaining safety measures — reflecting the challenges that many Sun Belt districts face this fall.

    Demographics for Andrews County, Texas
    Census population estimates, July 2019

    • Population: 19,000
    • Race: 56.6% Hispanic/Latino, 39.9% white, 2.0% Black, 1.5% Native American, 1.5% two or more races, 0.7% Asian
    • Education: 72.3% have high school degree, 12.2% have bachelor’s degree
    • Income: $76,200 is median household income, 10.2% in poverty
    • Computer: 91.6% have a computer, 86.2% have broadband internet
    • Free lunch: 47.9% of students eligible for free or reduced-price lunch1

    COVID-19 stats for Andrews Independent School District
    Texas Department of State Health Services, Public Schools COVID-19 data

    • Total enrollment: 4,000
    • In-person enrollment: 82% in late September, 2020; 100%, January through June, 2021
    • Total cases, 2020-2021 school year: 167 cases in students, 76 in staff
      • Clearfork Elementary School: 6 students, 0 staff
      • Underwood Elementary School: 9 students, 0 staff
      • Devonian Elementary School: 10 students, 0 staff
      • Andrews Education Center: 12 students, 1 staff
      • Andrews Middle School: 48 students, 0 staff
      • Andrews High School: 68 students, 0 staff
      • Unspecified campus: 14 students, 75 staff

    1Source: National Center for Education Statistics


    Preparing for reopening

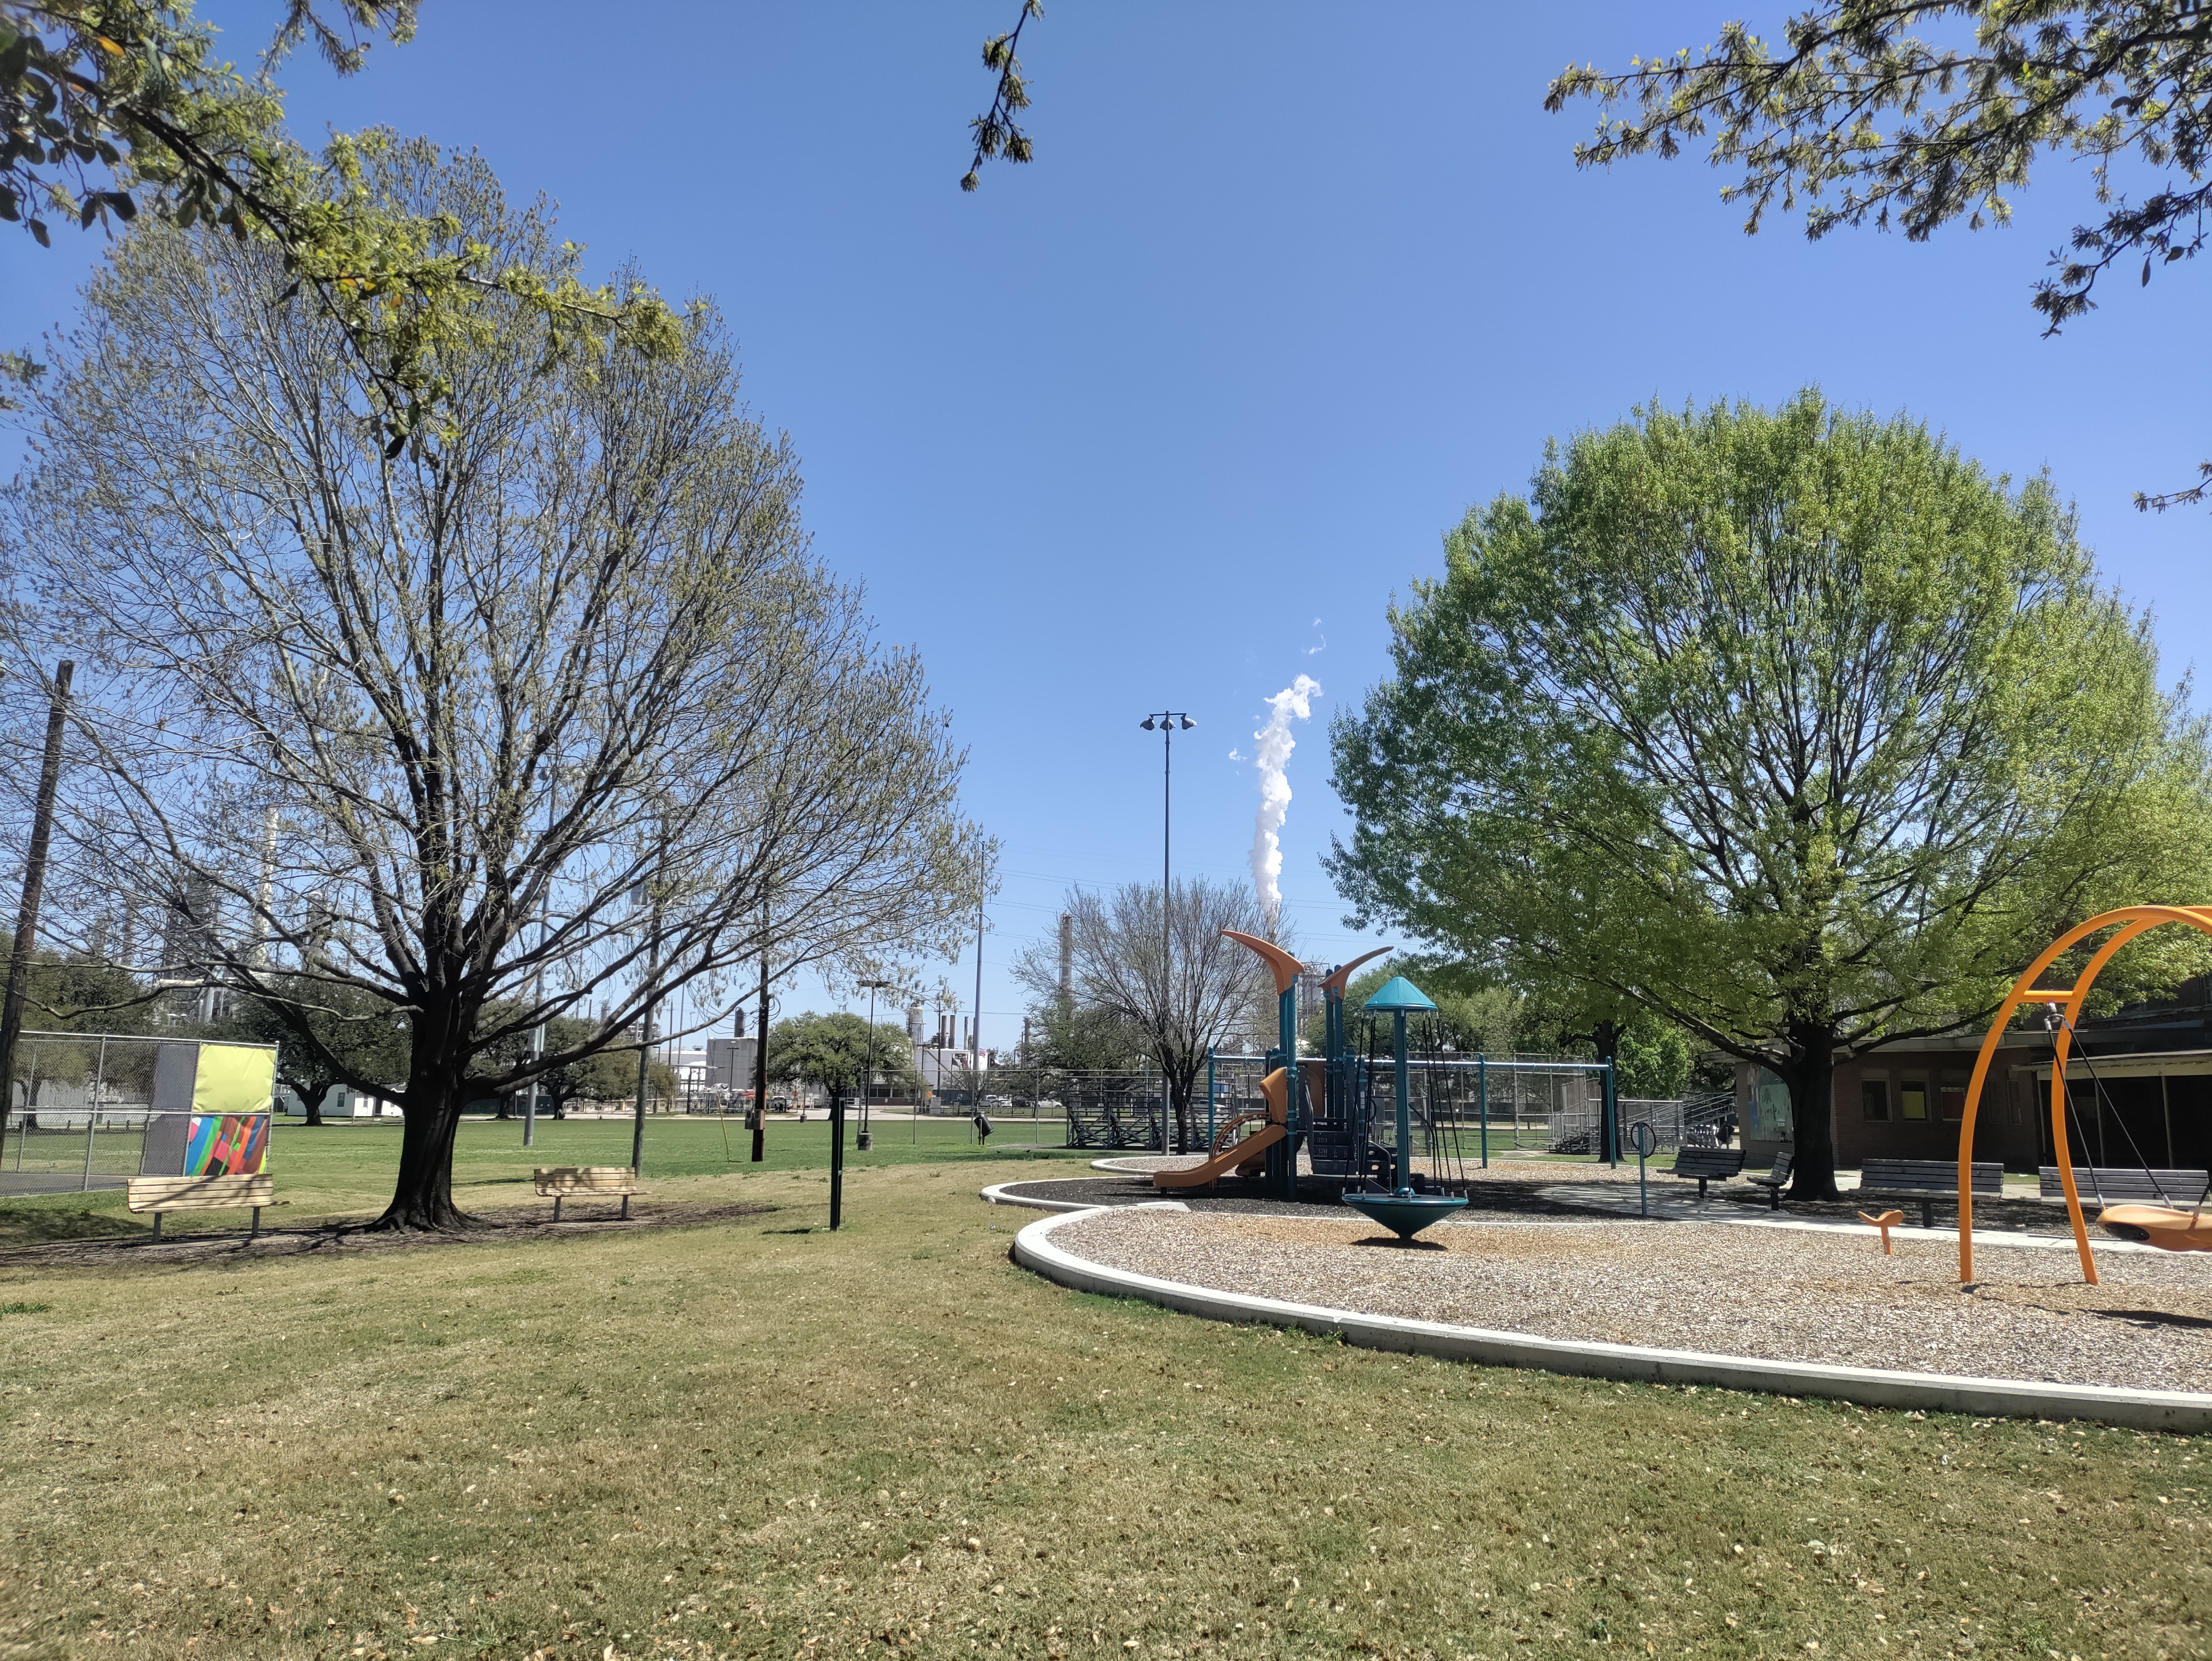
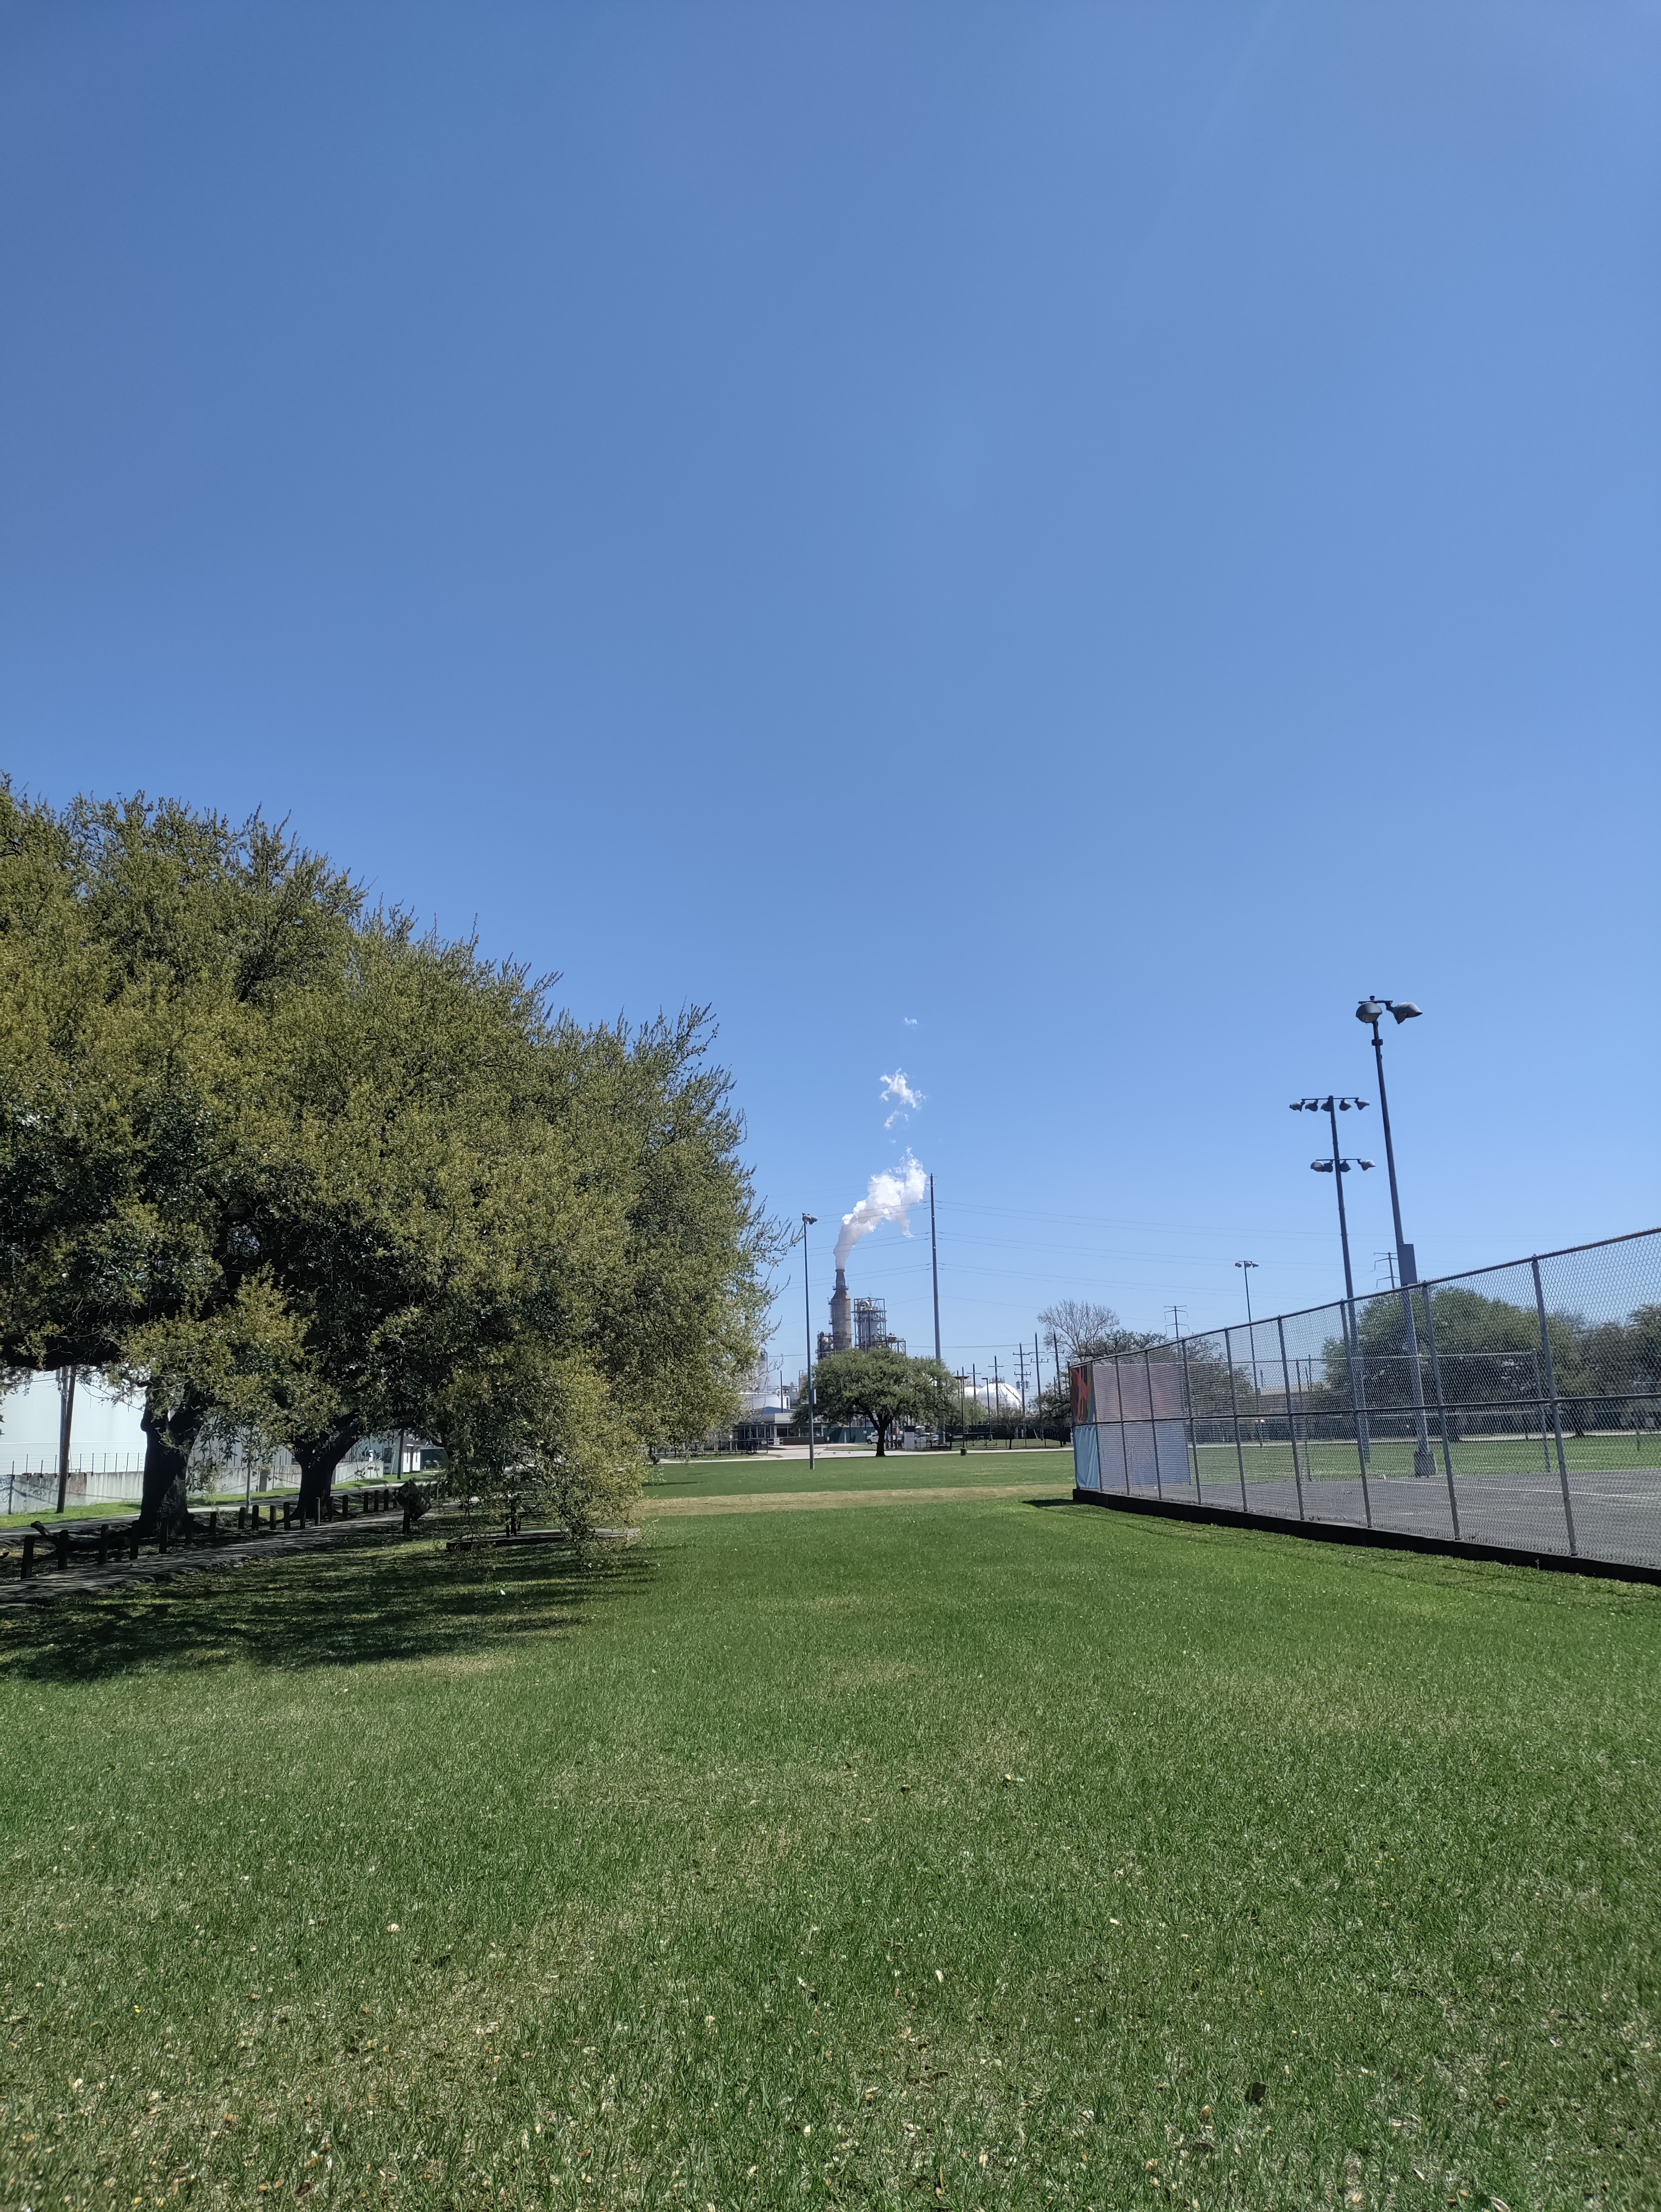
    When the schools shut down in March 2020, Andrews County was prepared to provide computers for all students. Still, remote learning proved challenging. Many Andrews parents work in the oil industry, which is a major employer in the region, and were unable to work from home — which left many students at home alone.

    As a result, when Gov. Greg Abbott announced a plan for fall reopening in June 2020, Andrews district administrators went full speed ahead. Planning for reopening relied on constant communication with the school board and the late July town hall, along with other opportunities for parents to provide feedback.

    Administrators also prepared for reopening by intensifying cleaning efforts at Andrews school buildings. The district hired an outside cleaning service to deep clean all buildings, both before the semester began and at regular intervals during the first couple weeks of classes.

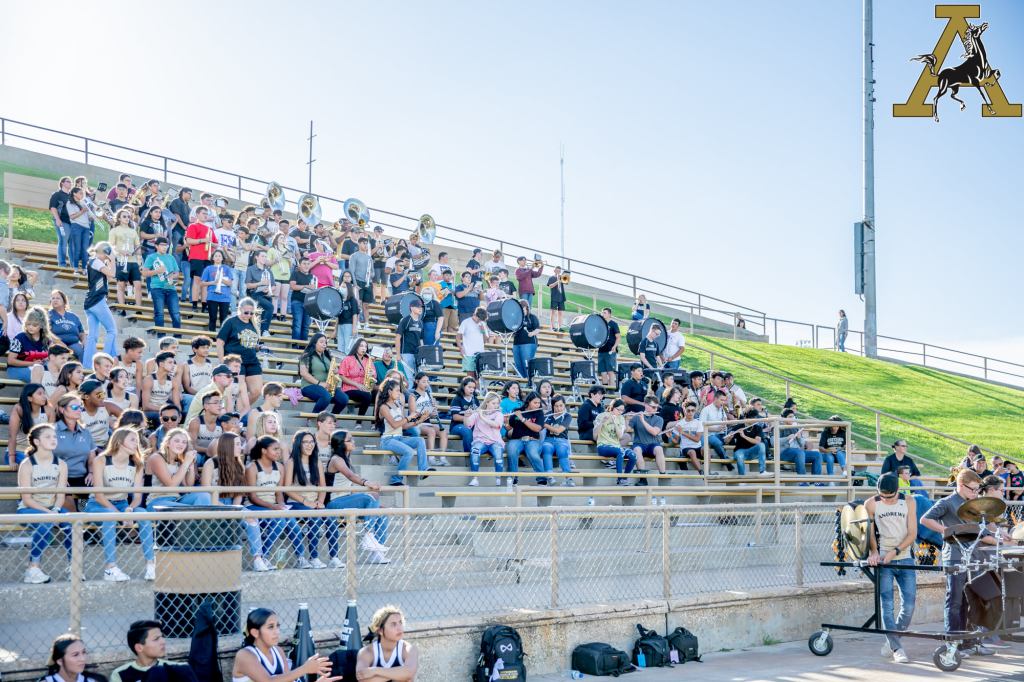
    All teachers and students in Andrews County had to choose between an all-in-person or all-virtual experience. Unlike other Texas districts, teachers were organized to lead either an entirely virtual or entirely in-person class — no need to teach hybrid classes and split focus between the students in a classroom and the students on Zoom. Meanwhile, students had to commit to in-person class in order to participate in sports or other extracurriculars. In late September, about 82% of students were attending class in person, according to Texas state health department data.

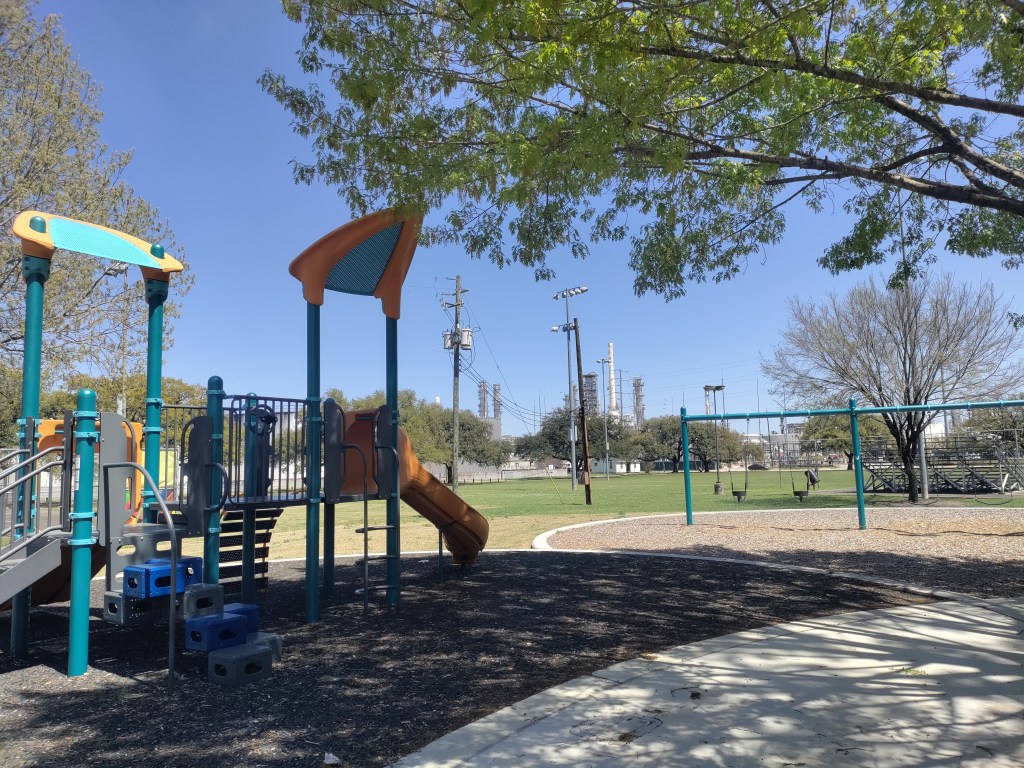
    Students who opted for those in-person classes had more outside time than in previous years. Andrews has a warm climate, with temperatures rarely falling below freezing; district staff took advantage by opening windows and doors to outside air, as well as holding class in the playground. Research suggests that outdoor coronavirus transmission is incredibly rare, and ventilation is more effective than cleaning in preventing the spread of aerosols — those tiny virus particles that travel through the air.

    “Anytime we could be outside, we did,” Azam said. He found that many students — who were stuck learning from home in spring 2020, while their parents were at work — were especially appreciative of the extra playtime.

    Parents’ choice — and parents’ responsibility

    Like other districts profiled in this series, the Andrews County school district partnered with the local public health department during its fall reopening. During the fall semester, the public health department shared information about new COVID-19 cases directly with school administrators — notifying the district about a new student case at the same time as the student’s parents. This method went above and beyond guidance from the state of Texas, which stipulated that parents should inform their school district of a case, then the district should inform the public health department. The rapid communication helped the district identify cases quickly and ensure that no cases were missed due to a parent’s reporting hesitancy.

    Once a case was identified, the classroom would be immediately cleared and custodians wiped down every surface that the student may have touched. The student’s parents would get a call to pick up their child, and notifications went out to families sharing a classroom with the infected child via ParentSquare, the school’s parent communication service. Those families were all able to access free, drive-through testing right at the local health department — with results in under 24 hours, according to Suzanne Mata, assistant superintendent of student services at the district.

    This health department partnership was challenged, however, by “differences of opinion” between district leadership and health workers, as Mata described the relationship. The Andrews school district opted not to require masks beyond the state guidance — which said children under 10 were exempt — and made quarantines optional when a case was identified. The department urged the district to follow CDC guidance: quarantine all exposed students and require masks for all children, including those under age ten.

    Rather than relying on strict restrictions, the district “utilized parents,” as Superintendent Azam put it. Parents were able to choose whether a child under age 10 required a mask, while also taking responsibility for other safety measures.

    “We said, ‘Mom, Dad, you know your kid better than us,’” Azam said. The district’s quarantine policy reflected this philosophy. While the district required any student with COVID-19 symptoms or a positive test result stay home from school, children who shared a classroom with an infected student had the choice to quarantine or continue coming to class as usual.

    “We just said, an individual has been in your student’s classroom… that has actually tested positive — please be aware to look for these symptoms,” Mata said, describing the notification that parents received after a positive case. The notice also reminded parents that any child with symptoms had to stay home.

    Gordon Mattimoe, director of the Andrews County Health Department, called the district’s policy “not ideal for mitigation.” After the fall 2020 semester and deterioration of the relationship between district and health department, as Mata described the situation, the health department stopped sharing case information directly with the school district. Instead, parents were asked to report any student cases, further placing the responsibility for COVID-19 mitigation on parents. Administrators felt that parents had sufficient understanding and trust in the district’s protocol to report cases responsibly.

    Transitioning to 100% in person

    !function(){“use strict”;window.addEventListener(“message”,(function(e){if(void 0!==e.data[“datawrapper-height”]){var t=document.querySelectorAll(“iframe”);for(var a in e.data[“datawrapper-height”])for(var r=0;r<t.length;r++){if(t[r].contentWindow===e.source)t[r].style.height=e.data["datawrapper-height"][a]+"px"}}}))}();

    The fall 2020 semester started off smoothly, except for a small outbreak in a sports team. As parents saw the district keep case numbers low — while remaining flexible on safety measures — in-person enrollment grew.

    “Every week, we had more and more kids… coming back face to face,” Superintendent Azam said. The students who had opted for the district’s virtual learning option struggled, both with getting assignments turned in and with mental health while home alone.

    As a result, the district decided to end the virtual option halfway through the fall semester, phasing students back in throughout October and November. During this transition, some families chose to drop out of the public school district entirely and switch to homeschooling or another option. According to data from the Texas public health department, the district’s total enrollment dropped by 157 students — from 4,149 in October 2020 to 3,992 in January 2021.

    In total, the Texas health department reported 167 cases among Andrews students over the course of the school year, representing about 4% of the total student body. They reported 76 cases among staff. The district saw its highest case spikes in November, December, and January, when the country was undergoing its highest surge, followed by almost zero cases between March and the end of the school year in late May. This may be an undercount, however, as the public health department was no longer sharing case data with the district during the spring.

    Superintendent Azam acknowledged that luck may have been a factor in Andrews’ low case counts; this rural district was not hit hard by COVID-19 like El Paso and other parts of Texas. The district also likely benefited from improved ventilation, via outdoor classes and open windows. Finally, while parents were expected to report cases to the school and take responsibility for quarantines, administrators say that trust built up throughout the fall semester enabled district parents and staff to become unified around the goal of keeping kids in classrooms and COVID-19 out of classrooms — making this individual responsibility system effective.

    The Andrews district has taken away key lessons from the 2020-2021 school year. These include: a continued focus on cleaning when COVID-19 or any other illness is identified in a school building; telling teachers and students to stay home if they feel sick; and holding class outside whenever possible.

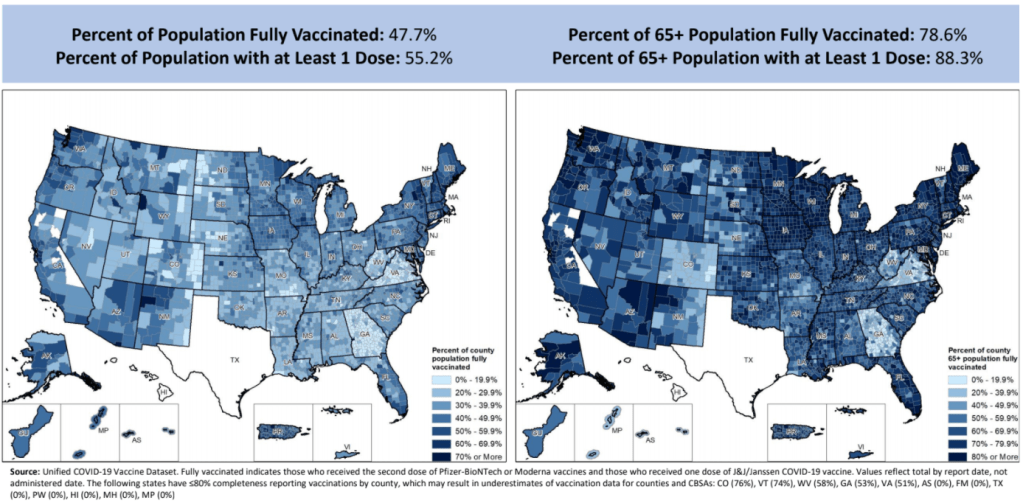
    As the Delta variant now sweeps through Texas and Governor Abbott blocks school mask mandates, Mattimoe, from the county health department, is concerned that Andrews’ flexible safety strategy may be harder to maintain this year. The public health department typically partners with the district on fall childhood vaccination events, he said, but opted not to hold events at the middle school this year due to COVID-19 vaccine polarization in the community. About 42% of the county’s eligible population is fully vaccinated as of August 28, according to Texas state data; the state average is 57%.

    “With the governor’s orders, the school is going back to business as usual,” Mattimoe said.

    Mata, the assistant superintendent, said that the district is “staying very vigilant” and aiming to “do what’s right for our students and our staff.” As of August 22, the district has yet to report any cases in the fall 2021 semester.


    The COVID-19 Data Dispatch’s “Opening” series is available for other publications to republish, free of charge. If you or your outlet is interested in publishing any part of this series, please contact betsy@coviddatadispatch.com.

    More from the Opening series

  • What’s up with Texas’ county-level vaccination data?

    What’s up with Texas’ county-level vaccination data?

    Vaccination rates by county, included in the July 8 HHS Community Profile report. Note the missing data for Texas.

    Anyone who’s tried to work with the federal government’s vaccination data has noticed this issue: there’s a Texas-shaped hole in the numbers.

    While the CDC and HHS report vaccination data for counties and metropolitan areas in the vast majority of states, data are missing for the entire state of Texas. Data are also incomplete for several other states, including Colorado, Nebraska, and Virginia.

    What’s up with Texas? A reporter friend recently asked me this question, inspiring me to look into the issue. There’s limited information directly on the CDC dashboard; a vague note in the Community Profile Reports simply notes that several states have “ ≤80% completeness reporting vaccinations by county,” including Texas at 0%—implying that the states, rather than the federal agency, is at fault.

    A great article by Houston Chronicle reporter Kirkland An dives into the precise issue. An cites a CDC page on county-level vaccination data reporting, which says that, “Texas provides data that are aggregated at the state level and cannot be stratified by county.” (I later realized that this page is linked in incredibly tiny text at the very bottom of the CDC’s dashboard—classic.) 

    Why is Texas providing state-level data? The answer, it turns out, lies with a unique state law:

    When asked about the lack of data, Douglas Loveday, a press officer with the Texas Department of State Health Services (DSHS), said, “State statute prevents us from sharing person-level immunization data.”

    Texas Health and Safety Code Sec. 161.0073 states that DSHS “may not release registry information to any individual or entity without the consent of the individual or the individual’s legally authorized representative.” There are exceptions to the rule, specifically reporting “non-identifying summary statistics.” But reporting individual records to the CDC, even if they have been stripped of identifying information, is not one of the exceptions granted by the code.

    In other words: almost every other state submits anonymous, line-level vaccination data to the CDC. Each line in the dataset represents one vaccinated individual, including their county of residence and other demographic information. The CDC aggregates this line-level information into the county-level statistics published on its dashboard. But Texas is prohibited from sending this type of individual data outside of the state without individual consent, so Texas is missing from the CDC data.

    Texas’ health agency does compile its own county-level vaccination data, which are available on the Texas COVID-19 vaccine dashboard. But most public health researchers (and journalists like yours truly) rely on the CDC’s standardized, national datasets—leaving Texas out of many important analyses on the vaccine rollout. 

    An reports that Texas’s agency does send the CDC aggregated county-level data; it’s just organized by vaccine provider, instead of by county of residence for vaccine recipients. The national agency is working with Texas to switch to county-of-residence reporting so that the state may appear in national datasets without breaking state law. Hopefully, that Texas-sized hole in the data may be filled soon.

    (It’s unclear whether similar efforts are underway for a Hawaii-sized hole in the same dataset; the CDC currently reports that Hawaii “does not provide CDC with county-of-residence information.”)

  • What’s up with testing in Texas?

    The COVID Tracking Project published a blog post this week in which three of our resident Texas experts, Conor Kelly, Judith Oppenheim, and Pat Kelly, describe a dramatic shift in Texas testing numbers which has taken place in the past two weeks.

    On August 2, the number of tests reported by Texas’s Department of State Health Services (DSHS) began to plummet. The state went from a reported 60,000 tests per day at the end of July to about half that number by August 12. Conor, Judith, and Pat explain that this overall drop coincides with a drop in tests that DSHS classifies as “pending assessment,” meaning they have not yet been assigned to a county. Total tests reported by individual Texas counties, meanwhile, have continued to rise.

    Although about 85,000 “pending assessment” tests were logged on August 13 to fill Texas’s backlog, this number does not fully add up to the total drop. For full transparency in Texas, DSHS needs to explain exactly how they define “pending assessment” tests, how tests are reclassified from “pending” to being logged in a particular county, and, if tests are ever removed from the “pending” category without reclassification, when and why that happens. As I mentioned in last week’s issue, DSHS has been known to remove Texans with positive antigen tests from their case count; they could be similarly removing antigen and antibody tests reported by counties from their test count.

    If you live in Texas, have friends and family there, or are simply interested in data issues in one of the country’s biggest outbreak states, I highly recommend giving the full post a read. For more Texas test reporting, check out recent articles from Politico and the Texas Tribune.

  • Antigen tests: fast, cheap, and almost diagnostic

    Antigen tests: fast, cheap, and almost diagnostic

    COVID-19 tests conducted in Texas as of August 8. Screenshot retrieved from the Texas Tests and Hospitals dashboard.

    So far in this pandemic, there have been two main players for determining who has been infected with SARS-CoV-2, the virus which causes COVID-19.

    There are polymerase chain reaction (PCR) tests, or molecular tests, which identify viral genetic material in a patient’s ear, nose, and throat cells. And there are antibody tests, or serology tests, which identify cells produced by a patient’s immune system response in their bloodstream. PCR tests are also called “diagnostic” tests, because they are used to conclusively diagnose patients with COVID-19.

    If you get a positive PCR test result, you know that you currently have the disease; you should begin self-isolating and should tell anyone with whom you recently had in-person contact to do the same. Antibody tests, on the other hand, are not diagnostic: they identify patients who have built up an immune response to COVID-19, likely (but not certainly) because they were infected with it. If you get a positive antibody test result, your local public health department would likely count you as a “probable” or “suspected” case.

    In May, however, a new type of testing came on the scene. The Food and Drug Administration (FDA) authorized its first antigen test on May 9, and its second antigen test on July 6. By the end of July, both types of antigen tests had been distributed to hundreds of nursing homes across the country.

    What are antigen tests? Antigen tests, like PCR tests, involve putting a swab up a patient’s nose. The swab takes a sample of potentially infected cells; the sample is then placed in a special chemical solution that breaks down the cells and flags the presence of antigens, unique pieces of the SARS-CoV-2 virus which normally live on the outside of the virus’ structure and are a key piece of immune system response. The testing process can be done in about fifteen minutes, and does not require the complex equipment needed to perform a PCR test.

    This ten-minute video from Medmastery gives a detailed explanation of how antigen tests work. You can also see a brief overview of how antigen tests compare to PCR and antibody tests here:

    Proponents of antigen tests suggest that these tests may one day become so readily available and so easy to use that high-risk workers and those in outbreak areas could test themselves before leaving the house. FDA leaders point out in their May 9 statement about the first authorized antigen test:

    Antigen tests are also important in the overall response against COVID-19 as they can generally be produced at a lower cost than PCR tests and once multiple manufacturers enter the market, can potentially scale to test millions of Americans per day due to their simpler design, helping our country better identify infection rates closer to real time.

    However, while antigen tests are technically diagnostic—they can tell you if you have COVID-19 right now—they do not meet the epidemiological gold standard for accurate testing. Antigen tests have a high specificity, meaning that they do not identify many false positives; if you receive a positive COVID-19 antigen test result, you can be pretty sure your result is correct. But they have a lower sensitivity than PCR tests, meaning that these tests may miss identifying people who are, in fact, infected with SARS-CoV-2. If you receive a negative COVID-19 antigen test result, but you have symptoms that match the disease or recently came into contact with someone who was infected, an epidemiologist would advise you to check your result by getting a PCR test.

    Antigen tests are useful in quickly identifying COVID-19 patients who may be isolated and begin receiving treatment. And, once these tests are more readily available, they will useful in determining infection rates in a broad population. But because of that low test sensitivity, someone with a positive antigen test result cannot be considered a “confirmed case of COVID-19” by public health departments.

    Who is conducting antigen tests? As I covered in last week’s issue of this newsletter, nursing homes are doing antigen tests, big time. On July 14, the Trump Administration and the Department of Health and Human Services (HHS) announced that COVID-19 antigen tests would be distributed to nursing homes in hotspot areas. On July 31, the CDC’s Dr. Robert Redfield claimed in the congressional subcommittee hearing on national coronavirus response that nearly one million of these test kits had already been distributed.

    The Associated Press reported on August 4 that, according to HHS’s Admiral Brett Giroir, this distribution program is on track to get 2,400 antigen test machines and test kits to go with them out to nursing homes by mid-August. However, the HHS’s supply only includes enough tests for most nursing homes to test all of their residents once, and all of their staff twice. Many nursing home administrators will need to make their own deals with suppliers, or get support from state public health departments, in order to continue doing antigen testing after their federal supplies run out.

    Antigen tests are also gaining prominence in Texas, where high case rates have put testing in high demand. In an analysis for the Houston Chronicle, published on August 2, Matt Dempsey, Stephanie Lamm, and Jordan Rubio estimated that tens of thousands of COVID-19 cases had been identified by antigen tests across the state. This analysis was based on data from the 11 Texas counties that published independent antigen test counts as of August 2. Texas’ Department of State Health Services (DSHS) only includes cases confirmed by PCR tests in its official total case count—a decision which may be more epidemiologically valid, but has caused confusion at the local level:

    On July 16, DSHS removed almost 3,500 cases from Bexar County’s case totals, saying the cases were “probable” and not confirmed because they were from antigen test results.

    San Antonio officials pushed back.

    “To be clear, this is not an ‘error’ in Metro Health’s reporting,” said Colleen Bridger, San Antonio’s interim director of public health, in a press release. “This is a disagreement over what should be reported in total counts.”

    On August 8, DSHS began reporting antigen tests on its Texas Tests and Hospitals dashboard. The August 8 numbers include about 14,000 total antigen tests, with about 2,000 positive results. Based on the Houston Chronicle’s analysis, this is likely a significant undercount—but at least Texas is starting to publish some numbers.

    How are antigen test results being reported nationally? Outside of Texas, antigen test numbers are hard to come by. As of the time I send this newsletter, only two other states report official antigen test counts: Kentucky and Utah. Kentucky reports 459 antigen tests as of August 8 (they do not report how many of these tests were positive). Utah reports about 5,000 people tested with antigen tests as of August 4, with about 500 of those people receiving a positive result.

    At the COVID Tracking Project, we have an important procedure: when folks on the data entry team notice that something new is happening with COVID-19 data—say, a new type of test gets approved by the FDA, or hospitals undergo a major change in their reporting protocol—we ask our outreach team, a group of reporters affiliated with the project, to write to every state public health department and ask them how they’re dealing with the change. Most states public health departments have now received questions about antigen testing (and pool testing, but that’s the subject for another newsletter). Answers generally fall in the range of, “We’re not doing antigen testing,” “We’re not doing it at the state level but some commercial labs are,” and “We’re starting to monitor it and include positive antigen tests as probable cases.”

    Pennsylvania is one example of the third approach:

    It’s not bad that states are including positive antigen tests as probable cases—as I said earlier, antigen tests are not accurate enough to confirm a case of COVID-19. But when states combine results from different test types in a single count, it is difficult to accurately calculate test positivity rates, testing rates per population, and other important metrics. COVID Tracking Project founders Alexis Madrigal and Rob Meyer explained this issue in detail back in May, when some states (and the CDC) were combining PCR and antibody test results. The same basic principle still applies: each test is used for a different purpose and has a different level of accuracy, and so its results should be reported separately.

    And what about those thousands of antigen tests that were distributed to nursing homes? As I reported in last week’s issue, the national Nursing Home COVID-19 Public File does not specify what types of tests nursing homes are using to identify cases, nor do state-reported datasets on COVID-19 in nursing homes. A FAQ document put out by the Center for Medicare and Medicaid Services (CMS) states that nursing homes are required to “report the results of the COVID-19 tests that they conduct to the appropriate federal, state, or local public health agencies.” This includes, presumably, state public health departments and the HHS. But it is unclear whether either HHS’s or CMS’s datasets will be adjusted to include antigen test counts. I reached out to CMS’s press office asking about these results, and have yet to receive a response.

    This is likely only the beginning for antigen tests. Politico reported earlier today that Admiral Giroir “hopes to have 20 million rapid point-of-care tests available per month by September.” Scientists quoted in a recent New York Times article cite antigen tests as a key technology for improving America’s testing speed. Both manufacturers producing FDA-approved antigen tests, Quidel and BD, cite supply issues which will make it difficult for them to meet demand from nursing homes and local public health departments. Still, the federal government has made antigen tests a priority, and I predict that their prevalence will only grow. COVID-19 data producers must adjust their reporting accordingly.