!function(){“use strict”;window.addEventListener(“message”,(function(a){if(void 0!==a.data[“datawrapper-height”]){var e=document.querySelectorAll(“iframe”);for(var t in a.data[“datawrapper-height”])for(var r=0;r<e.length;r++)if(e[r].contentWindow===a.source){var i=a.data["datawrapper-height"][t]+"px";e[r].style.height=i}}}))}();
Starting in 2024, the antiviral drug Paxlovid will be a private—and expensive—treatment for COVID-19. The Department of Health and Human Services (HHS) announced about a week ago that it’s reached a deal with Pfizer, the pharmaceutical company that produces Paxlovid, to “transition” this drug into the commercial market within the next few months. The transition will lead to Paxlovid becoming even less accessible than it is now and will exacerbate health inequities that we’ve seen with this drug.
A few days ago, news outlets reported that Pfizer will charge about $1,400 per course as the list price for Paxlovid upon this transition. This is about double the price that HHS previously paid for the drug, which was about $530 per course.
HHS previously purchased about 24 million courses of Paxlovid, of which about 17 million have been distributed and 11 million have been administered, according to the agency’s data. Under the privatization agreement, HHS will return about 8 million courses back to Pfizer, which will serve as a credit for covering continued free supply to people who have Medicare, Medicaid, or who are uninsured.
According to HHS, people who have public insurance or no health insurance should continue to receive free Paxlovid through the end of 2024. And after that, Pfizer will run a patient assistance program for people who are uninsured or underinsured. Still, the transition is likely to cause health equity issues, as people who have public insurance or no insurance will have to jump through more hoops to receive free Paxlovid under these programs, as opposed to the current situation where everyone can get it for free. We’ve all seen how chaotically this fall’s vaccine rollout went, after all.
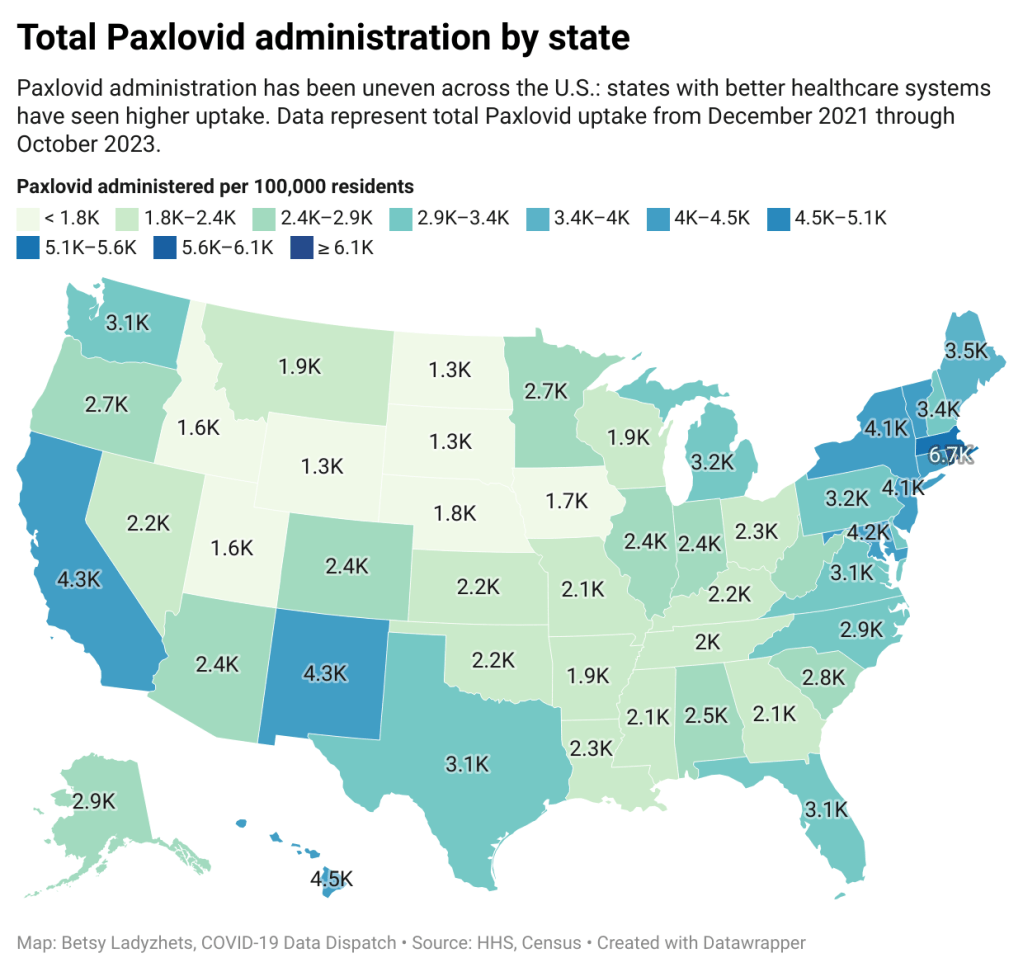
The HHS’s data for Paxlovid administration (shown above) demonstrate that states where healthcare is more easily accessible and/or where patient populations are wealthier tend to have higher rates of receiving Paxlovid over the nearly two years that it’s been available. We also know from scientific studies looking at Paxlovid that this drug has followed access issues similar to the COVID-19 vaccines and tests.
Considering these prior patterns, combined with the increasing price, it unfortunately seems like a foregone conclusion that Paxlovid will get harder to access in 2024. This will be a huge issue for preventing severe disease and death from COVID-19 as well as limiting risks of Long COVID, which research suggests Paxlovid can do as well.
If you are a reader who’s had a hard time getting Paxlovid, or if you want to share more comments or questions on this issue, please reach out.
I wanted to highlight a couple of questions (and comments) that I’ve received recently from readers, hoping that they will be useful for others.
Interpreting wastewater surveillance data
One reader asked about how to interpret wastewater surveillance data, specifically looking at a California county on the WastewaterSCAN dashboard. She noticed that the dashboard includes both line charts (showing coronavirus trends over time) and heat maps (showing coronavirus levels), and asked: “I’m wondering what the difference is, and which is most relevant to following actual infection rates and trends?”
My response: Wastewater data can be messy because environmental factors can interfere with the results, and what may appear to be a trend may quickly change or reverse course (this FiveThirtyEight article I wrote last spring on the topic continues to be relevant). So a lot of dashboards use some kind of “risk level” metric in addition to showing linear trends in order to give users something a bit easier to interpret. See the “virus levels” categories on the CDC dashboard, for instance.
Personally, I like to look at trends over time to see if there might be an uptick in a particular location that I should worry about, but I find the risk level metrics to be more useful for actually following infection rates. Of course, every dashboard has its own process for calculating these levels—and we don’t yet have a good understanding of how wastewater data actually correlate to true community infections—so it’s helpful to also check out other metrics, like hospitalizations in your county.
Rapid test accuracy
Another reader asked: “Is there any data on the effectiveness of rapid tests for current variants like Arcturus? I’m hearing more and more that they are working less and less well as COVID evolves.”
My response: Unfortunately, I’m not aware of any specific data on rapid test effectiveness for recent variants. Early in the Omicron period, there were a few studies that showed the rapid tests still worked for that variant. The virus has obviously evolved a lot since then, but there is less interest in and fewer resources for evaluating these questions at this point in the pandemic, so it’s hard to say whether the continued mutations have had a significant impact on test effectiveness.
I think it’s important to flag, though, that rapid tests have never been highly accurate. People have tested negative on rapids—only to get a positive PCR the next day—since these tests were first introduced in spring 2021. The tests can be helpful for identifying if someone is contagious, with a high viral load, but are less accurate for people without symptoms. So, my recommendation with these tests is always to test multiple times, and to get a PCR if you have access to that. (Acknowledging there is less and less PCR access these days.) Also, if you were recently exposed to COVID-19, wait a few days to start rapid testing; see more details in this post from last year.
Double dose of Paxlovid
Another reader wrote in to share their experience with accessing Paxlovid during a recent COVID-19 case. The reader received a Paxlovid prescription, which led to a serious alleviation of symptoms. But when she experienced a rebound of symptoms after finishing the Paxlovid course, she had a hard time getting a second prescription.
“Fauci, Biden, head of Pfizer and CDC director got a second course of Paxlovid prescribed to them,” the reader wrote. “When I attempted to get this, my doctors pretended I was crazy and said this was never done.” She added that she’d like to publicize the two-course Paxlovid option.
My response: I appreciate this reader sharing her experience, and I hope others can consider getting multiple Paxlovid prescriptions for a COVID-19 case. The FDA just provided full approval to Pfizer for the drug, which should alleviate some bureaucratic hurdles to access. I also know that current clinical trials testing Paxlovid as a potential Long COVID treatment are using a longer course; 15 days rather than five days. The results of those trials may provide some evidence to support a longer course overall.
If you have a COVID-19 question, please send me an email and I’ll respond in a future issue!
Paxlovid may lower risk of Long COVID: Taking paxlovid in the acute phase of a COVID-19 case may lower a patient’s risk of long-term symptoms by about 25%, according to a paper published this week in JAMA Internal Medicine. The paper, which summarizes an analysis of health records in the Veterans Affairs database, was originally posted as a preprint in the fall; lead author Ziyad Al-Aly and his colleagues at the St. Louis VA did more number-crunching during the peer review process. Several clinical trials (including one just announced at Yale this week) will test paxlovid as a potential treatment for Long COVID, with a longer course than people typically take during the acute disease.
Estimating true vaccination rates in the U.S.: A new report from the COVID States Project, a group of academic researchers focused on connections between social behaviors and COVID-19 spread, provides estimates of vaccination rates by state in the U.S. The researchers compared vaccination data from the CDC to polling sources, including the Kaiser Family Foundation and original polling conducted by the COVID States Project. They found that CDC data often diverged from survey data, suggesting that the public health agency’s information has errors due to the CDC’s inability to connect disparate immunization records from different states. (In other words, if someone got their primary series in one state and a booster in another, they might show up twice in the CDC’s data.)
Comparing COVID-19 outcomes by state: Another report looking at state-by-state data: researchers at the University of Washington’s Institute for Health Metrics and Evaluation compared COVID-19 death rates to state actions on COVID-19. The researchers found that states with higher poverty, more income inequality, higher Black and Hispanic/Latino populations, and less access to healthcare faced higher COVID-19 rates. States where more people voted for Trump in 2020 also saw more COVID-19. These patterns “seem to reflect the release of public health mandates” in more Republican states, journalist Amy Maxmen wrote in a Twitter thread summarizing the study.
COVID-19 origins docs, raccoon dog analysis: Federal intelligence documents about investigations into the coronavirus’ origins will be declassified in the coming months, as required by a new law that President Biden signed this week. The law specifically requires that the Director of National Intelligence release “all information relating to potential links between China’s Wuhan Institute of Virology and COVID-19.” This information will first go to Congress, and then may become public. Meanwhile, there’s been some controversy about a recent analysis of viral samples at the Huanan Seafood Wholesale Market in Wuhan: news about this analysis was shared in the media before a scientific report was completed, and some researchers who worked on the analysis had their access to sequence repository GISAID revoked. This article in Science Magazine has more details on the situation.
Increased Candida auris spread during the pandemic: C. auris is a pathogenic fungus that has developed resistance to multiple common drugs, and that can pose a serious threat to human health. (Yes, a fungus similar to the one that causes a pandemic in “The Last of Us”—though C. auris doesn’t turn people into zombies.) The fungus has spread more widely during the pandemic according to a recent CDC report, with a 44% increase in cases from 2019 to 2021. Other types of anti-microbial resistance have been on the rise as well, as COVID-19 led to less rigorous monitoring and heightened antibiotic use in many hospitals. More recent CDC data on the fungus are available here.
Updated booster doses by state: This week, the CDC started reporting how many people have received the bivalent, Omicron-specific boosters by state, including state-level data for several demographic groups (over age 5, over 12, over 18, and over 65). The numbers are low: Vermont and Washington, D.C. have the highest booster rates as of November 9, with 21% and 20% of their populations receiving the bivalent shots, respectively. In about half of states, less than 10% of the population has received an updated booster. (H/t Jason Salemi.)
Additional data suggests new boosters work against BQs: Speaking of the updated booster shots, a recent preprint from researchers at Emory University, Stanford University, and the NIH found that the new boosters produced several times more neutralizing antibodies against subvariants BQ.1.1 and BA.2.75.2 compared to the older vaccines. This was a small lab study and hasn’t yet been peer-reviewed, but it follows similar evidence from other research suggesting that the new boosters do provide additional protection against the most concerning variants currently circulating in the U.S. (See last week’s post.) If you haven’t gotten a bivalent booster yet, now is a good time!
More evidence that masks in schools prevent COVID-19 spread: Another notable new study this week, published in the New England Journal of Medicine: a group of researchers from Boston institutions examined the differences in COVID-19 case numbers between public school districts that kept mask requirements in place during spring 2022, and those that lifted their requirements upon a statewide policy change in February. Overall, ending required masking led to “an additional 44.9 COVID-19 cases per 1,000 students and staff” during the remainder of the semester, the researchers found. The study demonstrates that masks are still a useful public health strategy to reduce illness—and risk of Long COVID—in schools.
Paxlovid may reduce Long COVID risk: When Paxlovid first became available earlier in the year, some Long COVID patients reported that the drug helped alleviate their symptoms. A new study from Ziyad Al-Aly and his team at the Veterans Affairs St. Louis healthcare system provides evidence behind the anecdotal reports, finding that veterans treated with Paxlovid had a 25% lower risk of long-term symptoms, based on their electronic health records. The study has received some criticism (and has not yet been peer-reviewed); to me, it provides motivation for actual clinical trials examining Paxlovid’s use for treating Long COVID. RECOVER is running one such trial, but it won’t start until early 2023.
Estimating COVID-19 infections from wastewater: And one more study that caught my attention this week: researchers at the University of Florida used a modeling technique called a “mass balance equation” to estimate how many people in Gainseville, Florida were sick with COVID-19 based on the virus’ concentration in wastewater. Using about one year of wastewater data (May 2020 to May 2021), the researchers were able to accurately predict actual infections with an error of just 1%. Translating wastewater data into useful information for public health action has been a major challenge for the growing field, so I was glad to see this study providing a potentially-useful method.
More detailed bivalent booster data: As of this week, the CDC is reporting some demographic data for the bivalent, Omicron-specific booster shots. The new data suggest that these boosters have had higher uptake among seniors, with about 11 million people over age 65 receiving a shot (compared to just 60,000 in the 5 to 11 age group). White and Asian Americans have higher booster rates than Black, Hispanic, and Native Americans, suggesting that the new doses are following a similar equity pattern to what we’ve seen with prior vaccines.
COVID-19 mortality by occupation: A new report by the CDC’s National Vital Statistics System provides a rare area of data we don’t usually get in the U.S.: occupational data. CDC researchers used mortality data from 46 states and New York City to examine risk of death by occupation. People working in protective services, accommodation and food services, and other essential jobs that couldn’t be done remotely had the highest death rates—confirming what many public health experts have suspected throughout the pandemic.
Life expectancy changes during the pandemic: A new study published in Nature, by researchers at the University of Oxford and other European institutions, estimated how life expectancy changed in 29 countries since the start of the pandemic. After a universal life expectancy decline in 2020, the researchers found, some western European countries “bounced back” in 2021 while the U.S. and eastern European countries did not. The results show the impacts of lower vaccination uptake in the U.S., particularly among younger adults.
Disparities in Paxlovid prescriptions: Another CDC study that caught my attention this week was this analysis in Morbidity and Mortality Weekly Report (MMWR), describing racial and ethnic disparities in prescriptions of Paxlovid—the antiviral COVID-19 treatment which reduces risk of severe symptoms. Between April and July 2022, the researchers found, the share of COVID-19 patients over age 20 who received a Paxlovid prescription was 36% lower among Black patients than among White patients, and 30% lower among Hispanic patients. More work is needed to make Paxlovid availability more equitable.
New estimates of Long COVID prevalence: One more notable paper published this week: researchers at Massachusetts General Hospital, Harvard, and collaborators conducted an online survey of about 16,000 U.S. adults who tested positive for COVID-19 in the last two months. Of those survey respondents, 15% reported current symptoms of Long COVID. The survey found that older adults and women were more likely to report Long COVID, while those who were fully vaccinated prior to infection had a somewhat lower risk of long-term symptoms. All of these findings are in line with results from other studies, but it’s helpful to see continued validation of these known trends.
Household Pulse Survey updates, expands Long COVID data: This week, the CDC and Census released an update of their Household Pulse Survey results on how Long COVID is impacting Americans. In addition to more recent data on Long COVID prevalence, the update includes new information on how adults with the condition find it limiting their day-to-day activities. The data shows that, out of all adults currently experiencing Long COVID symptoms, over 80% have some activity limitations and 25% have “significant” activity limitations. (For more context on this dataset, see my post from June.)
NIH shares update on RECOVER study: Speaking of Long COVID, the National Institutes of Health’s Directors Blog shared a post this week with updates on its flagship RECOVER study to learn more about the condition. Major updates include: RECOVER’s current recruitment goal is 17,000 adults and 18,000 children; the NIH recently awarded more than 40 grants to research projects examining the condition’s underlying biology; and RECOVER is utilizing electronic health records to track patients over time. While this is all valuable progress, patient advocates have expressed concerns about limited involvement by post-viral chronic illness experts in RECOVER so far.
Paxlovid is going under-utilized, study finds: A new report from the health records company Epic Research provides evidence that Paxlovid reduces severe COVID-19 outcomes: patients over age 50 who received the antiviral drug were about three times less likely to be hospitalized, compared with those who didn’t. The study also found, however, that eligible Americans aren’t taking advantage of this treatment. Out of about 570,000 people who “could have received Paxlovid” between March and August 2022, only 146,000 (about one in four) actually got prescriptions. Paxlovid needs to be better advertised and easier to access.
New COVID-19 pill added to Medicines Patent Pool: And a new COVID-19 treatment option is becoming available internationally. Shionogi, a Japanese pharmaceutical company, recently signed an agreement with the Medicines Patent Pool, an international public health organization that facilitates increased drug access in low- and middle-income countries. The agreement allows other drug companies to make Shoinogi’s antiviral COVID-19 pill, called ensitrelvir fumaric acid, which has seen some promising results in clinical trials so far. Paxlovid and Molnupiravir (Merck’s antiviral pill) are already licensed by the pool.
Patient access to electronic health records expands: This past Thursday, new federal rules took effect requiring healthcare companies to “give patients unfettered access to their full health records in digital format,” as STAT News reporter Casey Ross put it. This is a major milestone for the democratization of health data, as patient records have historically been locked in a labyrinth of private databases—though more public education is needed to help people actually take advantage of the new rules. Personally, I hope this is a first step towards more record-sharing between health institutions, which could be a key step for more comprehensive analysis in the future.
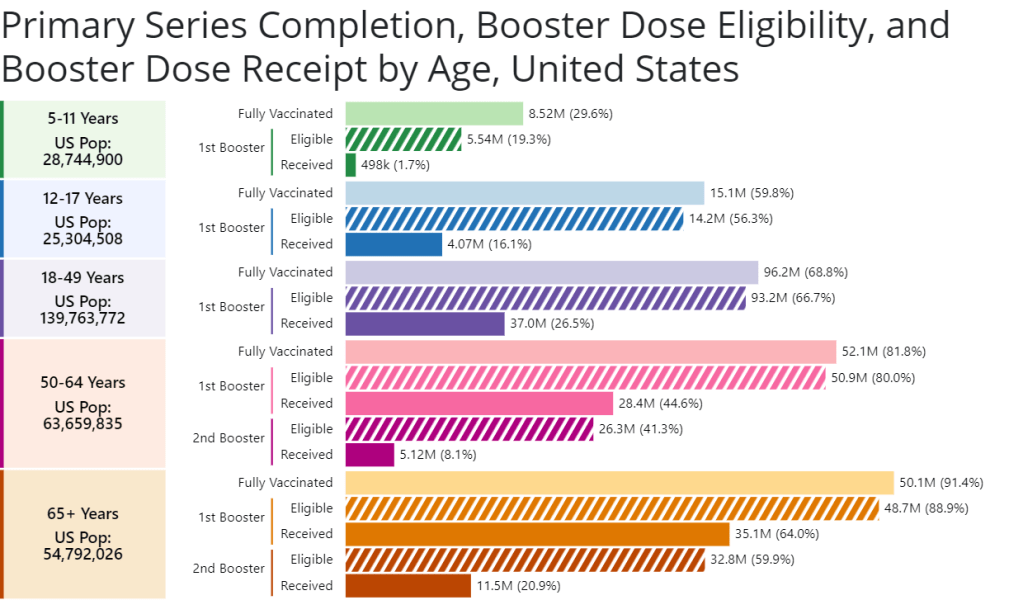
A new chart from the CDC shows booster shot eligibility and uptake by age. Retrieved on June 26.
CDC report on Paxlovid distribution: A major study from the CDC’s Morbidity and Mortality Weekly Report this week: researchers at the CDC and collaborators studied the distributions of antiviral COVID-19 drugs Paxlovid and Lagevrio (also called Molnupiravir) by ZIP code, comparing ZIP codes with the CDC’s Social Vulnerability Index. More than one million prescriptions were dispensed between late December 2021 and late May 2022, the study found. But, by the end of that period, prescription rates were twice as high in low- and medium-vulnerability ZIP codes as in high-vulnerabilty ZIP codes—indicating that these antivirals are not reaching the people who most need them.
CDC booster shot data update: The CDC has added a new chart to its “COVID-19 Vaccinations in the United States” page, showing booster shot eligibility and uptake by age. The chart includes two rounds of boosters for seniors; according to the data, 64% of eligible seniors have received their first booster, but only 21% have received their second booster. The data are also available for download.
COVID-19 vaccinations among children: I also recently learned about this CDC page focused on kids’ vaccinations, including vaccination coverage by demographic factors such as poverty status, parents’ education level, and insurance. The data come from a national survey previously used to monitor flu vaccinations among children. Data are updated monthly, and don’t yet include figures for children under 5; but existing data for children ages 5-17 affirm that vaccine uptake for kids has been low so far.
Guide to finding government COVID-19 documents: The Digital Public Library of America has released a free ebook with an archive of over 3,000 government documents related to the pandemic response. These documents were collected by the COVID Tracking Project during its year of work, and have been meticulously categorized and indexed in true CTP fashion. CTP alum Jennifer Clyde was the project’s editor.
Commonwealth Fund report on improving our public health system: A new report from healthcare-focused foundation The Commonwealth Fund provides recommendations for improving the country’s public health system. It focuses on organizing local agencies, providing more funding, improving trust, and other key topics.
History of exposure notification apps: Jenny Wanger, whom I interviewed about COVID-19 exposure notification apps back in spring 2021, sent me this paper she wrote about the technology, which was published earlier in June. The paper provides a report of how exposure notification protocols were developed, how states used the technology, and how limited data made it difficult to assess the technology’s success.
Last week, I shared a new page from the Department of Health and Human Services (HHS), reporting statistics on COVID-19 therapeutic distribution in the U.S. The new dataset is a helpful step, but it falls far short of the information we actually need to examine who has access to COVID-19 treatments (particularly Paxlovid) and address potential health equity issues.
The HHS dataset includes total counts of COVID-19 drugs ordered and administered in the U.S., both nationally and by state. It also includes weekly numbers of the doses available for health providers to order from the federal government (which the HHS calls “thresholds”), over the last five weeks; again, these are available nationally and by state.
As most of the monoclonal antibodies developed for earlier variants do not provide much protection against Omicron, the majority of treatments used in the country last month were antiviral drugs Paxlovid (made by Pfizer) and Molnupiravir (made by Merck).
Paxlovid is the most effective of the two, and the most in-demand. In recent weeks, some patients have reported difficulties with accessing this antiviral as BA.2 drives rising cases across the country. For instance, one COVID-19 Data Dispatch reader wrote to me last week to share that a family member who should’ve been eligible for Paxlovid had his prescription denied, as his pharmacy said the drug was in “limited supply.”
In the first Omicron surge, during the winter, Paxlovid definitely was in limited supply. Then, as that surge waned, supplies improved: a Washington Post article last month reported that the federal government had plenty of doses going unused, and health leaders like COVID-19 coordinator Ashish Jha wanted to raise awareness of the antiviral with providers and patients.
Now, as BA.2 and its subvariants drive a new surge, it’s unclear whether there are still plenty of Paxlovid doses for anyone who might need them—or whether the doses must once again be rationed for only the most vulnerable patients. If the latter is true, even if it’s true only in some states or counties hardest-hit by the Omicron variants, it’s a problem: as the U.S. seems completely unwilling to put in new safety measures, Paxlovid is an important tool to at least reduce severe disease and death. Without it, high-risk people are in an even worse position.
As a data journalist, I would love to investigate this problem by digging into federal data to see where Paxlovid is getting used, and where there may be gaps. But the existing data are pretty sparse: the HHS has published only limited national and state-level data, with the only numbers on doses actually ordered and administered being cumulative (i.e. totals over a five-month period). There’s no information on how Paxlovid prescriptions have changed in different states or counties over time, or of whether the drug is actually reaching vulnerable people who need it.
KHN’s Hannah Recht explained why this data gap is a problem for health providers prescribing Paxlovid, in an article earlier in May:
Los Angeles County’s Department of Public Health has worked to ensure its 10 million residents, especially the most vulnerable, have access to treatment. When Paxlovid supply was limited in the winter, officials there made sure that pharmacies in hard-hit communities were well stocked, according to Dr. Seira Kurian, a regional health officer in the department. In April, the county launched its own telehealth service to assess residents for treatment free of charge, a model that avoids many of the hurdles that make treatment at for-profit pharmacy-based clinics difficult for uninsured, rural, or disabled patients to use.
But without federal data, they don’t know how many county residents have gotten the pills. Real-time data would show whether a neighborhood is filling prescriptions as expected during a surge, or which communities public health workers should target for educational campaigns.
Yasmeen Abutaleb’s article in the Washington Post (linked above) also discusses the need for data:
Other experts welcomed the administration’s efforts, especially as cases rise, but said simply boosting the supply wasn’t enough, noting that inequities persist in who has access to Paxlovid. People without health insurance and those who live far away from medical providers or pharmacies are among those at highest risk from covid and face some of the highest hurdles to receiving effective treatment, said Julie Morita, executive vice president of the Robert Wood Johnson Foundation.
“It is essential that we collect and report data on who is receiving Paxlovid and other antiviral medications to swiftly pinpoint and address any disparities that emerge,” Morita said. “If done right, this can be a real turning point — but it is essential that all populations and communities have the opportunity to reap the benefits.”
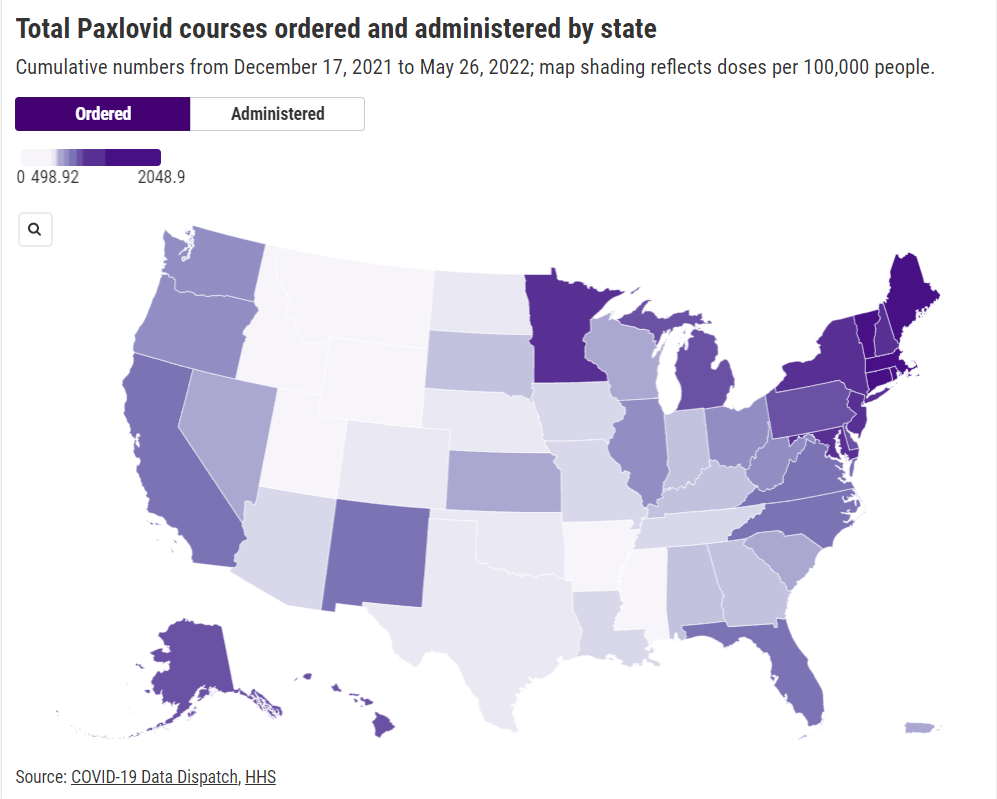
In short, if health providers like community clinics and pharmacies could see data on which communities are receiving Paxlovid prescriptions and which ones are not, they could work to fill the gaps. The existing state-by-state data (published after Recht’s article) is a helpful starting point, but still has little utility for local health officials.
Indeed, the limited state-by-state data already suggest that some states in the Northeast, the West Coast, and the Great Lakes region are ordering and administering more Paxlovid (relative to their populations), compared to others in the Midwest and South. This is a pattern worth examining further, but it’s difficult when the data are so unspecific.
Here’s my wishlist of Paxlovid data that would be more useful:
More granular geographies. State-level data is pretty useless if you run a local health clinic, or if you’re a local journalist. We need prescription information at the county level, if not even smaller regions (like census tracts or ZIP codes.)
Demographic data. Without data on race and ethnicity, age, or other demographic factors, it’s very difficult to determine whether Paxlovid is reaching people in an equitable way—or if access to the drug is becoming another way in which the pandemic disproportionately impacts already-marginalized groups.
Provider type. Along the same lines as demographic data, seeing how many Paxlovid doses are going through large pharmacies as opposed to community health centers, hospitals, or other types of healthcare providers could be a useful measure of equity.
Patient health conditions. People with health conditions that predispose them to severe COVID-19 symptoms (compromised immune systems, diabetes, kidney disease, etc.) are supposed to be at the front of the line for Paxlovid. We need data to see whether they are actually getting this priority treatment.
HHS begins releasing Paxlovid data: This past week, the Department of Health and Human Services (HHS) published data on how many courses of Paxlovid and other major COVID-19 therapeutics have been ordered and administered nationwide. As KHN reporter Hannah Recht pointed out on Twitter: “This is still not the detailed, complete data that county health officials need to do their jobs but it’s a start.” (See Recht’s article on this data gap for more context.)
COVID-19 Local Action Tracker: Since early 2020, the National League of Cities has tracked how cities and other local municipalities have responded to COVID-19. The tracker includes 800 cities and almost 5,000 policies, impacting over 100 million people; it links out to policy documents for each item. (H/t Data Is Plural.)
FEMA funeral assistance: The Federal Emergency Management Agency (FEMA) has distributed over $2 billion in aid for COVID-19 funerals since the beginning of the pandemic, supporting more than 300,000 families, the agency announced in a press release this spring. The press release also includes data providing the number of applicants and total funds awarded in each state.
New Long COVID studies with electronic records: Two recent papers on Long COVID caught my attention this week. First, researchers at data nonprofit FAIR Health analyzed a cohort of 78,000 Long COVID patients using a new diagnostic code for the condition, leading to useful findings about potential demographics and risk factors. Second, researchers at the University of North Carolina, the University of Colorado, and other collaborators used machine learning techniques on health records to identify potential Long COVID patients. Both studies used electronic health records to include wider patient pools than typical U.S. Long COVID research.
Limited immunity after Omicron infection: Another notable paper, published this week in Nature: researchers at Gladstone Institutes, a research organization in San Francisco, examined immunity after Omicron infections by testing out potential immune responses to different variants in mice and analyzing human serological samples. Their results suggest people infected with Omicron after vaccination have more protection against variants other than Omicron compared to unvaccinated people, which may only be protected against future Omicron infections.
FDA authorizes combined at-home test for COVID-19, flu, RSV: And a piece of diagnostic news for this week: for the first time, the FDA has provided emergency use authorization to an at-home test that can distinguish between COVID-19, the flu, and RSV. Processing the test does involve mailing results of a nasal swab to the testing company, Labcorp, so it’s not as simple as the at-home COVID-only tests we’ve all grown used to. Still, this authorization is an important step for future testing.