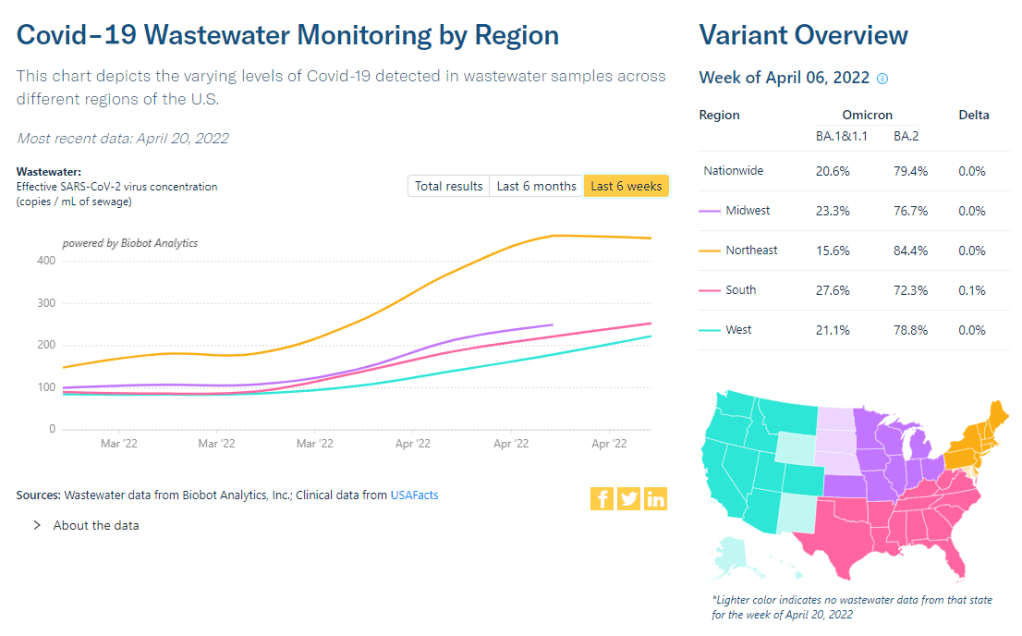
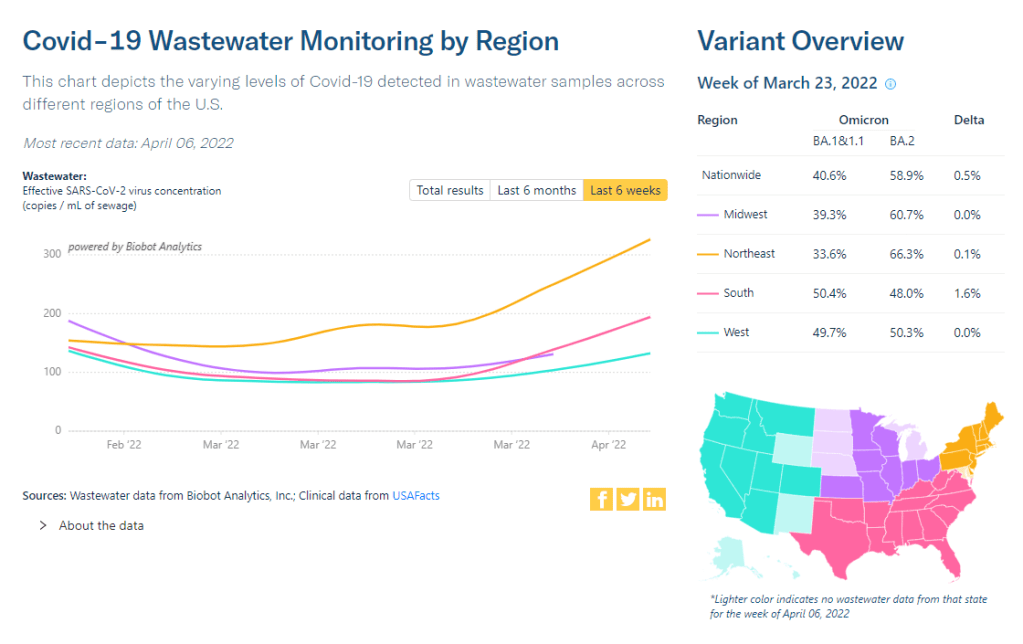
Coronavirus levels in wastewater may be plateauing in the Northeast, while the remaining regions of the country catch up. Chart via Biobot, retrieved on April 24.
In the past week (April 16 through 22), the U.S. reported about 300,000 new COVID-19 cases, according to the CDC. This amounts to:
An average of 43,000 new cases each day
91 total new cases for every 100,000 Americans
35% more new cases than last week (April 9-15)
In the past week, the U.S. also reported about 11,000 new COVID-19 patients admitted to hospitals. This amounts to:
An average of 1,600 new admissions each day
3.4 total admissions for every 100,000 Americans
8% more new admissions than last week
Additionally, the U.S. reported:
2,600 new COVID-19 deaths (0.8 for every 100,000 people)
93% of new cases are Omicron BA.2-caused; 19% BA.2.12.1-caused (as of April 16)
An average of 100,000 vaccinations per day (per Bloomberg)
After weeks of me warning about it, a BA.2 surge is upon us. Nationwide, new COVID-19 cases have gone up for the third week in a row; we’ve seen a 68% increase since the last week of March.
And that’s just the reported cases: Americans may be doing about four times more at-home tests than they’re doing lab-based PCR tests, according to Mara Aspinall, a COVID-19 testing expert (who cowrites a testing-focused newsletter). The vast majority of these at-home tests are never reported to public health officials and don’t make it into our trends analysis.
But there are other metrics that similarly indicate a national rise in coronavirus transmission. Viral levels in wastewater are going up, according to both Biobot’s tracker and the CDC’s national monitoring system; the CDC’s COVID-19 data team noted in this Friday’s Weekly Review that “more than half of all sites reporting wastewater data are experiencing a modest increase in SARS-CoV-2 levels.” Some of these increases are going from very low to still low, but they’re still worth watching.
The U.S. is also reporting an increase in new COVID-19 patients admitted to hospitals: about 11,000 people this week, up from 10,000 last week. New hospitalizations lag behind cases slightly, but they are a more reliable metric, as anyone with symptoms severe enough to require hospitalization generally will seek care (so, underreporting is less of a concern.)
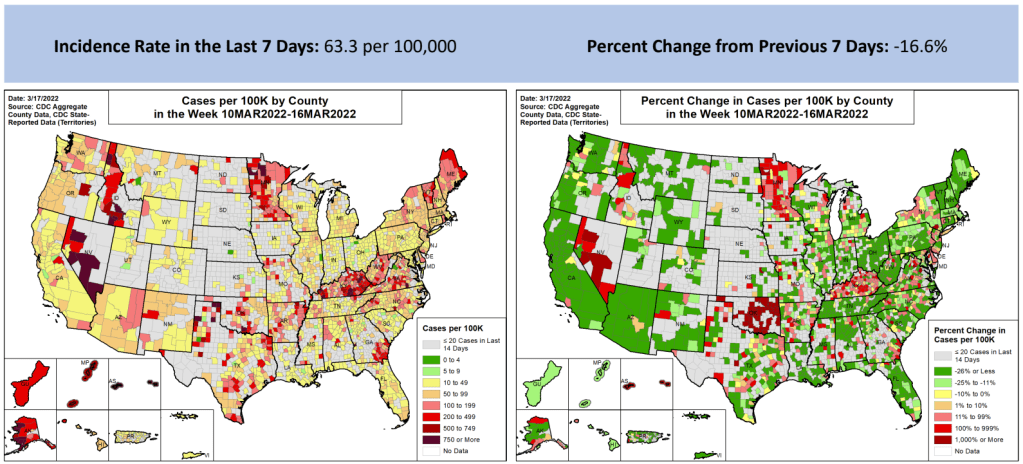
At the regional level, the Northeast is still seeing the highest case rates: leading jurisdictions include Vermont, Washington D.C., New York, Rhode Island, and Massachusetts, according to the April 21 Community Profile Report. The Northeast—particularly New York and New Jersey—is also a hotspot for the Omicron sub-subvariant, BA.2.12.1.
To borrow an analogy from my sister (an engineering student): the emergence of these new Omicron sublineages feels like when you’re trying to do a problem set that claims to have five problems, but then each problem has several sub-problems, and those sub-problems themselves have more sub-problems. In the coming weeks, we’ll see just how much more transmissible Omicron can get.
There’s some good news, though: cases in some parts of the Northeast might be plateauing. It’s hard to tell for sure because of the aforementioned unreliable data, but wastewater data for the region (as well as for individual cities like Boston) seem to be leveling off; we’ll see next week if this trend continues.
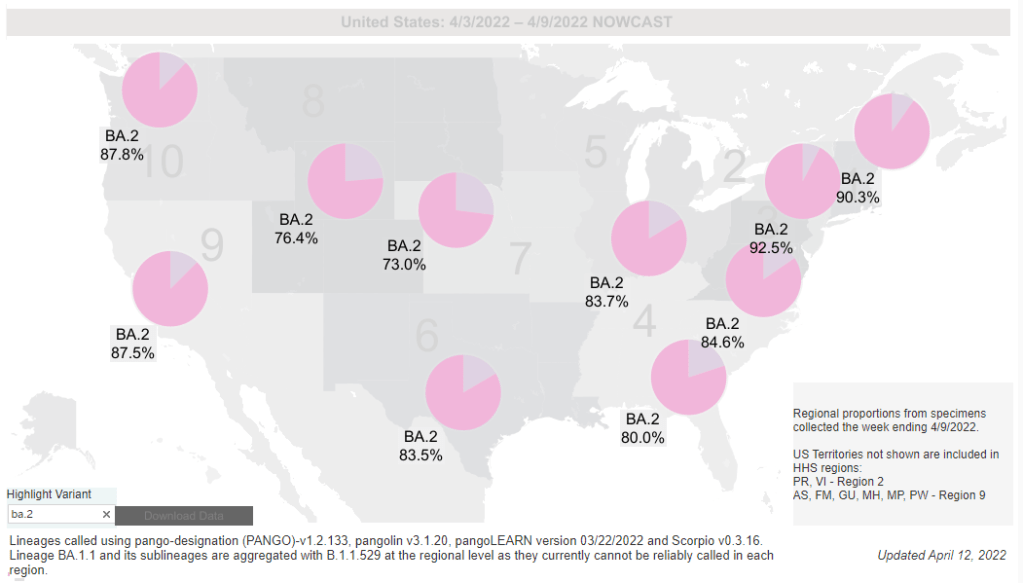
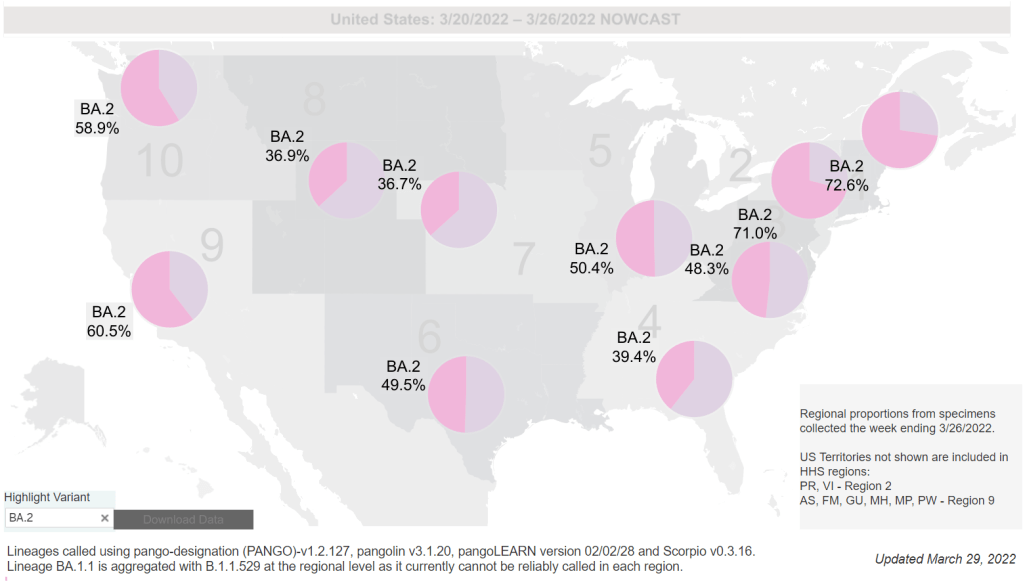
BA.2 levels are particularly high (93% prevalence) in the New York/New Jersey region, and new sublineages have recently been identified in New York. Chart via the CDC.
As though it’s not already confusing enough to distinguish between Omicron BA.1 and BA.2, more sublineages have popped up in recent weeks as Omicron continues to spread and mutate. Here are two that I’m watching, though they don’t seem to be major causes for concern at this time.
BA.2 sublineages in New York
Last week, the New York State Department of Health announced that it has identified new sub-variants of BA.2, called BA.2.12 and BA.2.12.1, through testing and sequencing. The BA.2 lineage overall accounts for the vast majority of cases in New York, and these two new strains are causing over 90% of new cases in the central part of the state.
These two sublineages seem to be spreading even faster than original BA.2 in New York, with a growth advantage of about 25%—perhaps explaining in part why the state is once again seeing higher case rates than other parts of the country. It’s unclear so far whether these BA.2 offshoots will have any impact on severity or vaccine effectiveness; the health department is looking into this.
Also worth noting: New York has a more robust variant surveillance system than a lot of other states. It’s very possible that Omicron is mutating elsewhere in the country, too; but those potential sublineages haven’t been identified yet.
The number of cases so far may seem to be insignificant compared with the steep Omicron peak of the winter, but “we’re essentially back at levels of case rates back to the Delta wave,” said Eli Rosenberg, deputy director for science at the New York State Department of Health. “This would have been a very significant wave already by last year’s standards.”
XE recombinant in the U.K. and other countries
This new offshoot hasn’t been identified in the U.S. yet, but it deserves some attention. Essentially, BA.1 and BA.2 have combined—likely in regions or even in individual people that are experiencing simultaneous infections of both strains—and formed what scientists call a “recombinant” variant, with some genetic material from both. The BA.1/BA.2 conglomerate has been labeled XE.
According to research so far, XE may have a slight growth advantage over BA.2. The World Health Organization (WHO) estimated that XE is about 10% more transmissible than BA.2, but further study is needed to confirm this number. Over 600 XE cases have been identified in the U.K., according to TIME, along with smaller numbers in India, Thailand, and other countries.
Scientists aren’t particularly concerned about XE at this point because it hasn’t been spreading rapidly and outcompeting other variants, like the original Omicron did in the winter. But agencies like the U.K.’s Health Security Agency and the WHO are monitoring for any worrying signals.
In the past week (April 9 through 15), the U.S. reported about 220,000 new COVID-19 cases, according to the CDC. This amounts to:
An average of 31,000 new cases each day
67 total new cases for every 100,000 Americans
19% more new cases than last week (April 2-8)
In the past week, the U.S. also reported about 10,000 new COVID-19 patients admitted to hospitals. This amounts to:
An average of 1,400 new admissions each day
3.1 total admissions for every 100,000 Americans
1% more new admissions than last week
Additionally, the U.S. reported:
2,900 new COVID-19 deaths (0.9 for every 100,000 people)
100% of new cases are Omicron-caused; 86% BA.2-caused (as of April 9)
An average of 100,000 vaccinations per day (per Bloomberg)
New COVID-19 cases in the U.S. have gone up for the second week in a row, and the increase was sharper this week. While the daily average of new cases (about 31,000) remains low compared to the Omicron surge, this trend is still concerning—especially when factoring in all the at-home rapid tests that are going unreported right now.
Wastewater trends suggest that cases will continue rising in the coming weeks. Biobot’s dashboard suggests a national increase (most pronounced in the Northeast region), while about 60% of sites in the CDC’s network have reported increasing coronavirus levels in the last two weeks.
Newly hospitalized COVID-19 patients, an indicator that’s typically behind cases but more reliable, is also showing a small increase as of this week. This will be an important metric to watch in the next few weeks: will BA.2 strain hospitals the same way that Omicron BA.1 did in December and January?
BA.2, it’s important to note, is now causing the vast majority of new COVID-19 cases in the U.S. The CDC’s latest estimates suggested that this sublineage made up 86% of cases in the week ending April 9. And some parts of the country may be seeing further mutation of BA.2—more on that later in the issue.
The Northeast continues to be a leader in this surge, as shown by both the wastewater trends and case data. According to the April 14 Community Profile Report, states with the highest case rates in the last week include: Vermont, Washington D.C., Rhode Island, New York, Massachusetts, Alaska, New Jersey, Maine, Connecticut, and New Hampshire.
All of these states are seeing high transmission, according to the CDC’s old guidance. But the new guidance places most counties in these states in low or medium “community levels;” largely because hospitalizations—which, again, are a lagging indicator—haven’t started rising yet.
This week, Philadelphia became the first major U.S. city to once again require masks in public indoor spaces, in response to rising cases and hospitalizations. I hope to see other cities and localities follow Philadelphia’s lead, but I know current attitudes make this unlikely.
Last fall, I wrote—both in the COVID-19 Data Dispatchand for FiveThirtyEight—that the U.S. did not have the data we needed to make informed decisions about booster shots. Several months later, we still don’t have the data we need, as questions about a potential BA.2 wave and other future variants abound. Discussions at a recent FDA advisory committee meeting made these data gaps clear.
Our country has a fractured public health system: every state health department has its own data systems for COVID-19 cases, vaccinations, and other metrics, and these data systems are often very difficult to link up with each other. This can make it difficult to answer questions about vaccine effectiveness, especially when you want to get specific about different age groups, preexisting conditions, or variants.
To quote from my November FiveThirtyEight story:
In the U.S., vaccine research is far more complicated. Rather than one singular, standardized system housing health care data, 50 different states have their own systems, along with hundreds of local health departments and thousands of hospitals. “In the U.S., everything is incredibly fragmented,” said Zoë McLaren, a health economist at the University of Maryland Baltimore County. “And so you get a very fragmented view of what’s going on in the country.”
For example, a database on who’s tested positive in a particular city might not be connected to a database that would reveal which of those patients was vaccinated. And that database, in turn, is probably not connected to health records showing which patients have a history of diabetes, heart disease or other conditions that make people more vulnerable to COVID-19.
Each database has its own data fields and definitions, making it difficult for researchers to integrate records from different sources. Even basic demographics such as age, sex, race and ethnicity may be logged differently from one database to the next, or they may simply be missing. The Centers for Disease Control and Prevention, for instance, is missing race and ethnicity information for 35 percent of COVID-19 cases as of Nov. 7.*
*As of April 9, the CDC is still missing race and ethnicity information for 35% of COVID-19 cases.
This past Wednesday, the FDA’s Vaccines and Related Biological Products Advisory Committee (VRBPAC) met to discuss the future of COVID-19 booster shots. Notably, this committee didn’t actually need to vote on anything, since the FDA and CDC had already authorized a second round of boosters for Americans over age 50 and immunocompromised people the week before.
When asked why the FDA hadn’t waited to hear from its advisory committee before making this authorization decision, vaccine regulator Peter Marks said that the agency had relied on data from the U.K. and Israel to demonstrate the need for more boosters—combined with concerns about a potential BA.2 wave. The FDA relied on data from the U.K. and Israel when making its booster decision in the fall, too; these countries, with centralized health systems and better-organized data, are much more equipped to track vaccine effectiveness than we are.
With that authorization of second boosters for certain groups already a done deal, the VRBPAC meeting this past Wednesday focused more on the information we need to make future booster decisions. Should we expect annual COVID-19 shots, like we do for the flu? What about shots that are designed to combat specific variants? A lot of this is up in the air right now, the meeting discussion indicated.
Also up in the air: will the FDA ever host a virtual VRBPAC meeting without intensive technical difficulties? The meeting had to pause for more than half an hour to sort out a livestream issue.
we can pull together extraordinary vaccines in under a year we can cook up oral antivirals that slash hospitalization and death rates by 90% we can manufacture great masks, and detect viral infections with 15-minute tests
we cannot get VRBPAC livestreams to work
— Katherine J. Wu, Ph.D. (@KatherineJWu) April 6, 2022
Here are some vaccine data questions that came up on Wednesday, drawing from my own notes on the meeting and the STAT News liveblog:
How much does protection from a booster shot wane over time? We know that booster shots increase an individual’s protection from a coronavirus infection, symptoms, hospitalization, and other severe outcomes; CDC data presented during the VRBPAC meeting showed that, during the Omicron surge, Americans who were boosted were much more protected than those with fewer doses. But we don’t have a great sense of how long these different types of protection last.
How much does booster shot protection wane for different age groups? Waning immunity has been a bigger problem among seniors and immunocompromised people, leading to the FDA’s decision on fourth doses for these groups. But what about other age groups? What about people with other conditions that make them vulnerable to COVID-19, like diabetes or kidney disease? This is less clear.
To what degree is waning immunity caused by new variants as opposed to fewer antibodies over time? This has been a big question during the Delta and Omicron surges, and it can be hard to answer because of all the confounding variables involved. In the U.S., it’s difficult to link up vaccine data and case data; tacking on metrics like which variant someone was infected with or how long ago they were vaccinated often isn’t possible—or if it is possible, it’s very complicated. (The U.K. does a better job of this.)
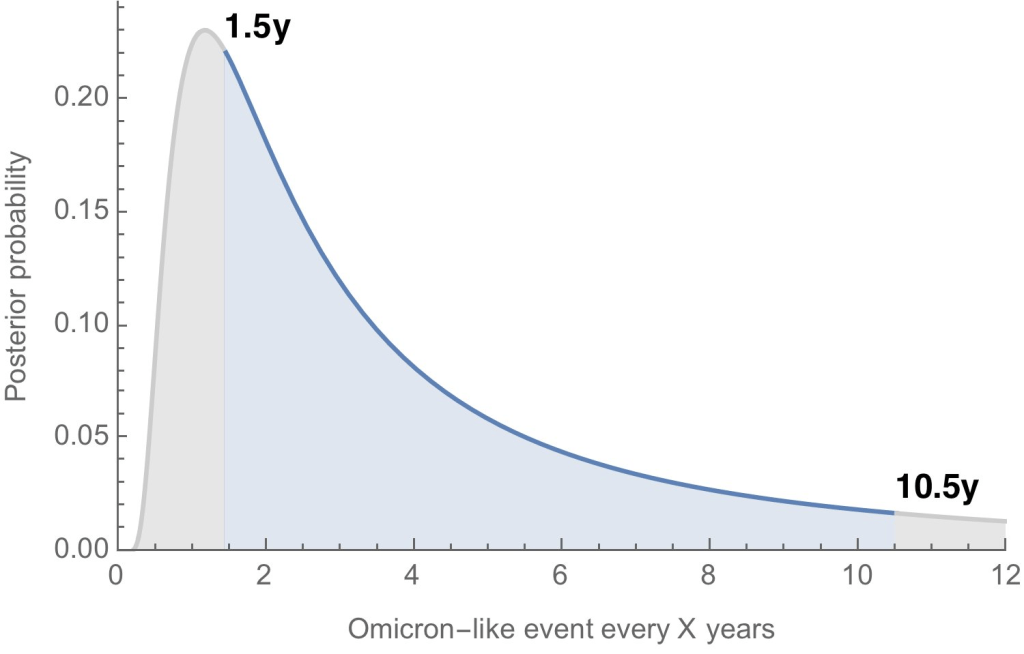
Where will the next variant of concern come from, and how much will it differ from past variants? Computational biologist Trevor Bedford gave a presentation to VRBPAC that attempted to answer this question. The short answer is, it’s hard to predict how often we’ll see new events like Omicron’s emergence, in which a new variant comes in that is extremely different from the variants that preceded it. Bedford’s analysis suggests that we could see “Omicron-like” events anywhere from every 1.5 years to every 10.5 years, and we should be prepared for anything on that spectrum. The coronavirus has evolved quite quickly in the last two years, Bedford said, and will likely continue to do so; though he expects some version of Omicron will be the main variant we’re dealing with for a while.
What will the seasonality of COVID-19 be? The global public health system has a well-established process for developing new flu vaccines, based on monitoring circulating flu strains in the lead-up to flu seasons in different parts of the world. Eventually, we will likely get to a similar place with COVID-19 (if annual vaccines become necessary! also an open question at the moment). But right now, the waxing and waning of surges caused by new variants and human behavior makes it difficult to identify the actual seasonality of COVID-19.
At what point do we say the vaccine isn’t working well enough? This question was asked by VRBPAC committee member Cody Meissner of Tufts University, during the discussion portion of the meeting. So far, the most common way to measure COVID-19 vaccine effectiveness in the lab is by testing antibodies generated by a vaccine against different forms of the coronavirus. But these studies don’t account for other parts of the immune system, like T cells, that garner more long-term protection than antibodies. We need a unified method for measuring vaccine effectiveness that takes different parts of the immune system into account, along with real-world data.
How might vaccine safety change over time? This question was brought up by Hayley Ganz of Stanford, another VRBPAC committee member. The CDC does have an extensive system for monitoring vaccine safety; data from that system should be readily available to the experts making booster shot decisions.
Today, I presented to @US_FDA VRBPAC with an overview of SARS-CoV-2 evolution up to this point and a brief perspective for what to expect going forward. Slides are here: https://t.co/QnzOctVCSN and my slot in the full recording is viewable here: https://t.co/n5rlgOvtEg. 1/13
Another thing I’m wondering about right now, personally, is how the U.S.’s shifting focus away from case data might make all of this more complicated. As public health agencies scale down case investigations and contact tracing—and more people test positive on at-home, rapid tests that are never reported to these agencies—we’re losing track of how many Americans are actually getting COVID-19. And breakthrough cases, which are more likely to be mild or asymptomatic, might also be more likely to go unreported.
So, how does the U.S. public health system study vaccine effectiveness in a comprehensive way if we simply aren’t logging many of our cases? Programs such as randomized surveillance testing and cohort studies might help, but outside of a few articles and Twitter conversations, I’m not seeing much discussion of these solutions.
Finally: a few friends and relatives over age 50 have asked me about when (or whether) to get another booster shot, given all of the uncertainties I laid out above. If you’re in the same position, here are a couple of resources that might help:
Coronavirus levels in wastewater are now rising in all regions of the country, according to Biobot. Screenshot taken on April 9.
In the past week (April 2 through 8), the U.S. reported about 190,000 new COVID-19 cases, according to the CDC. This amounts to:
An average of 27,000 new cases each day
57 total new cases for every 100,000 Americans
5% more new cases than last week (March 26-April 1)
In the past week, the U.S. also reported about 10,000 new COVID-19 patients admitted to hospitals. This amounts to:
An average of 1,400 new admissions each day
3.0 total admissions for every 100,000 Americans
10% fewer new admissions than last week
Additionally, the U.S. reported:
3,500 new COVID-19 deaths (1.1 for every 100,000 people)
100% of new cases are Omicron-caused; 72% BA.2-caused (as of April 2)
An average of 100,000 vaccinations per day (per Bloomberg)
After several weeks in a plateau, new COVID-19 cases in the U.S. are once again going up at the national level. The CDC reported an average of 27,000 new cases a day last week—less than one-tenth of what we saw during the Omicron surge, but still a notable uptick from the week prior.
National numbers of newly hospitalized patients and COVID-19 deaths are both still trending down; this is unsurprising, as trends in hospitalizations and deaths typically follow cases by several weeks.
That wastewater signal likely means that cases will keep going up in the next couple of weeks. BA.2 is a clear culprit for this: the more-contagious Omicron sublineage is now causing about three in four new COVID-19 cases in the U.S., according to the CDC’s latest estimates. BA.2’s dominance led the FDA to pull its emergency use authorization for Sotrovimab, a monoclonal antibody drug that works against Omicron BA.1—but not against BA.2,
As we’ve seen for the last couple of weeks, the Northeast continues to be a leader in case increases. Jurisdictions with the highest cases per capita in the week ending April 6 are Alaska, Vermont, Rhode Island, Washington, D.C., New York, Massachusetts, New Jersey, and Maine. All reported more than 100 new cases for every 100,000 residents, per the latest Community Profile report.
Under the CDC’s old community level guidance, all of these Northeast states (and Alaska) would be classified as seeing high transmission. But under the new, more lenient guidance, 99% of the country—including most counties in these states—are classified as “low” or “medium” community levels.
These lenient levels don’t account for warnings in our wastewater, not to mention under-testing as PCR sites close and at-home tests go unreported. As Katherine Wu wrote in The Atlantic this week, the U.S. may be facing a new surge, but it’s harder to accurately track COVID-19 now than it has been since spring 2020. Don’t let the low numbers fool you into thinking all is well.
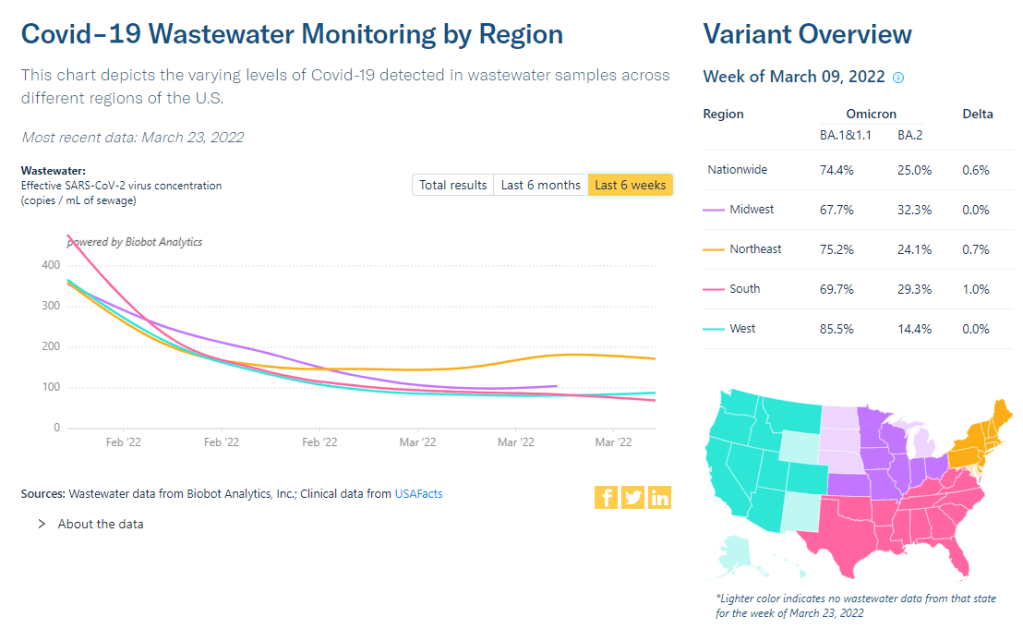
BA.2 caused more than two-thirds of new COVID-19 cases in the Northeast in the week ending March 26, according to CDC estimates. It’s no coincidence that this region is also seeing cases start to tick up.
In the past week (March 26 through April 1), the U.S. reported about 180,000 new COVID-19 cases, according to the CDC. This amounts to:
An average of 26,000 new cases each day
55 total new cases for every 100,000 Americans
3% fewer new cases than last week (March 19-25)
In the past week, the U.S. also reported about 11,000 new COVID-19 patients admitted to hospitals. This amounts to:
An average of 1,600 new admissions each day
3.3 total admissions for every 100,000 Americans
16% fewer new admissions than last week
Additionally, the U.S. reported:
4,400 new COVID-19 deaths (1.3 for every 100,000 people)
100% of new cases are Omicron-caused; 55% BA.2-caused (as of March 26)
An average of 90,000 vaccinations per day (per Bloomberg)
Nationwide, COVID-19 cases in the U.S. have reached a plateau. New cases decreased only 3% from the previous week to this week, following an 8% decrease the week before that. New hospitalizations and deaths are also declining slightly, approaching the same plateau pattern.
Wastewater is showing a similar pattern, too. The overall, national trend of coronavirus levels in wastewater has been in a plateau for a couple of weeks now, according to the Biobot dashboard. Regionally, the Northeast saw a slight uptick followed by an even slighter downturn, and the South may be seeing a slight uptick now.
BA.2, the Omicron sublineage that is more transmissible than the version of this variant that first reached us in the U.S., is now causing over half of new COVID-19 cases nationwide, according to CDC estimates. Two weeks ago, I wrote that 50% prevalence was a threshold for cases starting to increase in Europe; if the U.S. follows Europe (as we usually do), that means we’ll start seeing case increases here in the next week.
According to the CDC’s estimates, BA.2 is already causing almost 75% of new cases in the New England and New York/New Jersey regions. It’s unsurprising, then, that several Northeast states have reported case increases in the last week. According to the latest Community Profile Report, states that reported increases above 25% week-over-week include: Arizona, Alabama, Ohio, Delaware, North Carolina, Hawaii, Massachusetts, and New York.
New York City—an early hotspot for BA.2, as it was for the original Omicron strain in December—reported more than 100 cases for every 100,000 residents last week, according to both city data and the CDC’s figures.
Under the old CDC thresholds, this would have put the city in a “high transmission” zone, indicating that all residents should mask up in public, indoor spaces. However, the new CDC guidance places New York City in a “low” level, meaning masks are not recommended—a clear example of the lenience in this new guidance.
It’s good news that we’re not seeing a sharp BA.2-driven increase here in the U.S. yet, either within coronavirus levels in wastewater or within the case data. A BA.2 surge here may likely be a small bump rather than a huge wave. Still, the new lenience in safety measures—combined with federal funding running out for free testing, vaccinations, and other COVID-related coverage—is making me pretty nervous.
The Northeast has seen a small uptick in coronavirus levels in its wastewater in recent weeks, followed by a plateau. Chart via Biobot Analytics.
In the past week (March 19 through 25), the U.S. reported about 190,000 new COVID-19 cases, according to the CDC. This amounts to:
An average of 27,000 new cases each day
58 total new cases for every 100,000 Americans
5% fewer new cases than last week (March 12-18)
In the past week, the U.S. also reported about 13,000 new COVID-19 patients admitted to hospitals. This amounts to:
An average of 1,800 new admissions each day
3.9 total admissions for every 100,000 Americans
21% fewer new admissions than last week
Additionally, the U.S. reported:
5,200 new COVID-19 deaths (1.6 for every 100,000 people)
100% of new cases are Omicron-caused; 35% BA.2-caused (as of March 19)
An average of 100,000 vaccinations per day (per Bloomberg)
New COVID-19 case numbers for the U.S. overall are still decreasing, according to the CDC’s data. But the drop from the previous week’s cases to this week’s cases (about 5%) is lower than any week-over-week change since Omicron peaked in January, suggesting that we’re heading for a plateau—if not a new increase.
Last week, I discussed a potential new surge in the U.S. driven by the Omicron sublineage BA.2, which is more transmissible than the version of Omicron we faced a couple of months ago. BA.2 caused about 35% of new COVID-19 cases nationwide in the week ending March 19, according to CDC estimates, up from 22% in the prior week.
As BA.2 slowly outcompetes the other Omicron sublineages in the U.S., we also continue to see case upticks in some parts of the country. States that reported case increases in the last week include Arkansas, Kentucky, Maine, New York, Colorado, Massachusetts, and Vermont, according to the March 24 Community Profile Report. (Arkansas and Kentucky reported week-over-week increases above 25%, while the other states here reported increases above 10%.)
Wastewater data align somewhat with these case increases. Biobot’s tracker shows a slight uptick (followed by a plateau) in coronavirus levels in the Northeast’s wastewater, at a regional level, along with plateaus in other parts of the country. And about 40% of sites in the CDC’s national wastewater network have reported increases over the last two weeks—though the CDC’s data are difficult to interpret, as this tracker doesn’t provide context on actual wastewater levels at each site.
To be clear, it’s good news that we aren’t seeing major case increases yet, just some small upticks. At the same time, numbers of newly hospitalized COVID-19 patients and deaths are dropping to levels not seen since last summer; this week, about 750 people died of the disease each day, according to the CDC—the first time this number has been under 1,000 in several months.
The 7-day avg for new hospital admissions in the U.S. (confirmed + suspected COVID) is now also at an all-time low pic.twitter.com/99LPzBCYKw
In a recent TIME article, several experts suggested that vaccines plus lingering immunity from the Omicron wave in December and January may protect the U.S. from a major surge with BA.2. Still, with safety measures dropping across the country, in the event that we do see a major new surge (from BA.2 or otherwise), we won’t be prepared to curb virus transmission in a meaningful way.
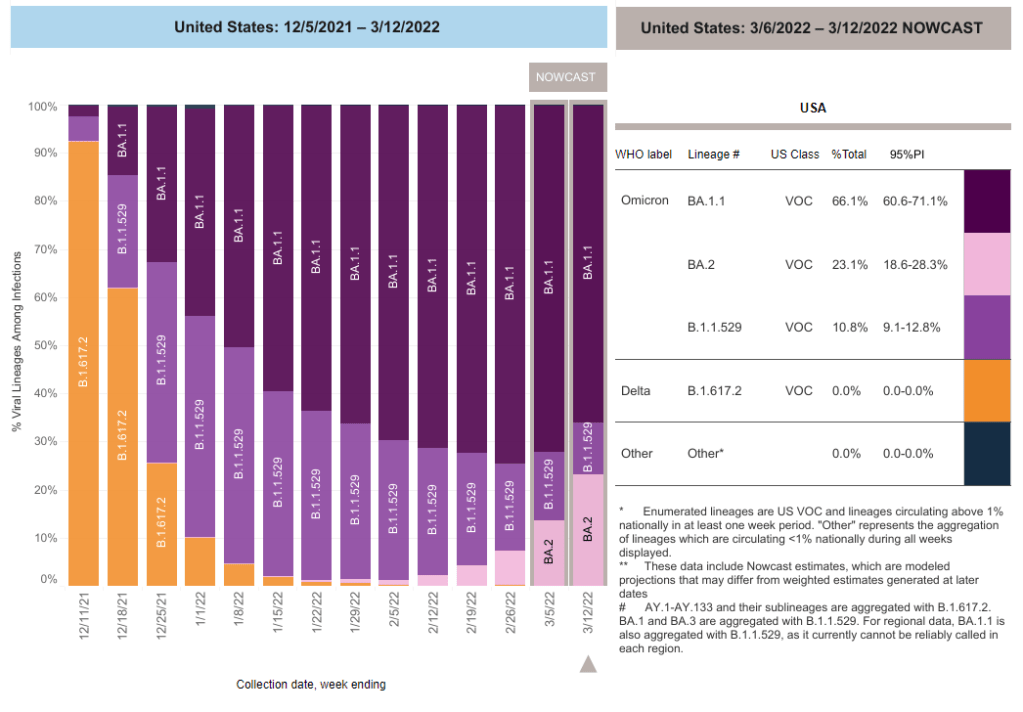
BA.2 caused about one in four U.S. COVID-19 cases in the week ending March 12, according to CDC estimates.
Two years into the pandemic, we now know some basic truisms about the coronavirus. For example: outdoor events are always safer than indoor events; older age is the most significant risk factor for severe symptoms; hospitalization trends typically follow case trends by a couple of weeks; and whenever Europe has a new surge, the U.S. is likely to also see a surge in the next month or so.
That last truism is particularly relevant right now, because Europe is experiencing a new surge. Cases are increasing in the U.K., Germany, the Netherlands, and many other countries. The new surge is likely due to European leaders’ decisions to end all COVID-19 safety measures in their countries, combined with the rise of Omicron sublineage BA.2.
As BA.2 prevalence increases here in the U.S.—and our leaders also end safety measures—we seem poised to follow in Europe’s footsteps once again. But a BA.2 surge is likely to look different from the intense Omicron surge that we experienced in December and January, in part because of leftover immunity from that Omicron surge.
Let’s go over what we know about BA.2, and what might happen in the next few weeks.
What is BA.2?
It’s important to note that this isn’t a new variant, at least not compared to the original Omicron strain. As I noted in a FAQ post about this strain back in January, South African scientists who originally characterized Omicron in November 2021 identified three sub-lineages: BA.1, BA.2, and BA.3.
BA.1 spread rapidly through the world, driving the surge that we experienced here in the U.S. in December through February. But BA.2, it turns out, is actually more transmissible than BA.1—allowing it to now outcompete that strain and contribute to case increases in countries that already faced major BA.1 surges.
How does BA.2 differ from BA.1, or original Omicron?
The main difference between these two strains is that BA.2 is more contagious: scientists estimate that BA.2 is about 30% more transmissible than other Omicron strains, if not more. (Note that this is a smaller difference than Omicron’s advantage over Delta and other earlier variants.)
In a recent report, the U.K. Health Security Agency estimated that someone infected with BA.2 would infect about 13.6% of their households and 5.3% of contacts outside of their households, compared to 10.7% of households and 4.2% outside contacts for other Omicron strains. The modest difference between these rates demonstrates why BA.2 is not outcompeting other Omicron strains as quickly as Omicron outcompeted Delta a couple of months ago.
Another notable feature of BA.2 is that, unlike BA.1, it can’t be identified with a PCR test. BA.1 has a mutation called S drop-out, which causes a special signal in PCR test results, allowing the variant to be flagged without sequencing; BA.2 doesn’t have this mutation. To be clear, a PCR test will still return a positive result for someone who is infected with BA.2—it’ll just take an additional sequencing step to identify that they have this particular strain.
Finally, one major challenge during the Omicron BA.1 surge has been that two of the three monoclonal antibody treatments used in the U.S. did not work well for people infected with Omicron. BA.2 may exacerbate this challenge, as some studies have suggested that the third treatment—called sotrovimab—continued working against BA.1, but may not hold up against BA.2. Luckily though, Eli Lilly (which developed one of the treatments that failed for BA.1) has produced an updated monoclonal antibody cocktail that does work for both Omicron strains.
How is BA.2 similar to BA.1, or original Omicron?
Two major pieces of good news here: 1) our existing COVID-19 vaccines work similarly well against BA.2 as they do against BA.1, and 2) prior infection with BA.1 seems to be protective against infection with BA.2.
Essentially, studies are showing that the two strains are close enough in their genetic profiles that antibodies from a BA.1 infection will provide some immunity against a BA.2 infection. And the same thing goes for vaccination, at least when it comes to protection against severe disease. A recent CDC study showed that, even during the Omicron surge, COVID-19 patients who had received three vaccine doses were far less likely to require mechanical ventilation or die from the disease than those who weren’t vaccinated.
There’s a flip side to this, though: for both BA.1 and BA.2, prior infection with a previous variant is not very protective against an Omicron infection. CDC seroprevalence data suggest that between 40% and 45% of Americans got infected with BA.1 during the winter surge; this means the remaining 55% to 60% of the population is susceptible to BA.2. Vaccines protect against severe disease and death from BA.2, but they don’t protect against BA.2 infection to the degree that they did against past variants.
This means that in terms of protection against infection, populations with high rates of vaccination or prior infection remain essentially naive to it. Though vaccines and prior infections still protect from severe disease and death (thanks to T-cell protection). 3/ pic.twitter.com/gmwlk2l7ZV
— Prof Francois Balloux (@BallouxFrancois) March 19, 2022
BA.2 and BA.1 are also similar in their severity. Both strains are less likely to cause severe disease than Delta; BA.1 had a 59% lower risk of hospital admission and 69% lower risk of death than Delta in the U.K., according to a new paper published this week in the Lancet.
It’s important to remember, however, that Delta was actually more severe than other variants that preceded it. As a result, “Omicron is about as mild/severe as early 2020 SARSCoV2,” wrote computational biologist Francois Balloux in his Twitter thread (referring to both BA.1 and BA.2).
What are the warning signs for a BA.2 surge in the U.S.?
First of all, many U.S. experts consider case increases in Europe to be an early indicator of increases in the U.S. As I said at the top of the post, Europe is seeing a surge right now, and many of the countries reporting case increases have estimated over 50% of their cases are caused by BA.2.
In the U.S., our BA.2 levels are lower: the CDC’s most recent estimates suggested that BA.2 was causing about 23% of new cases nationwide as of March 12. If BA.2 continues growing at the same rate we’ve seen in recent weeks, we have one or two more weeks before this variant hits 50% prevalence in the U.S.
“The tipping point seems to be right around 50%,” Keri Althoff, an epidemiologist at Johns Hopkins Bloomberg School of Public Health, told CNN. “That’s when we really start to see that variant flex its power in the population” as far as showing its severity.
At the same time, several Asian countries are also seeing major BA.2 surges at the moment. For example, Hong Kong was able to deal with early Omicron cases earlier in the winter, former COVID Tracking Project lead Erin Kissane pointed out in her Calm Covid newsletter; but now, the territory is facing a terrible BA.2 wave, driving what is now the world’s highest case fatality rate.
NEW: I’m not sure people appreciate quite how bad the Covid situation is in Hong Kong, nor what might be around the corner.
First, an astonishing chart.
After keeping Covid at bay for two years, Omicron has hit HK and New Zealand, but the outcomes could not be more different. pic.twitter.com/1Ol4HHs9kT
Here in the U.S., we’re also seeing warning signals in the form of rising coronavirus levels in wastewater. (Wastewater is considered an early indicator for surges, because coronavirus material often shows up in sewer systems before people begin to experience symptoms or get tested.) About one-third of sewershed collection sites in the CDC’s wastewater monitoring network are reporting increased virus prevalence in the two-week period ending March 15.
The CDC wastewater data must be interpreted cautiously, however, as this surveillance network is biased towards states like Missouri and Ohio, which have over 50 collection sites included in the national network. 12 states still do not have any collection sites in the network at all, while 23 states have fewer than 10. This recent Bloomberg article includes more context on interpreting wastewater data.
New York City is one place that’s reporting increased viral levels in wastewater, at the same time as the city health department reports that case numbers have plateaued—or may even be ticking up. An excellent time to loosen all mask and vaccination requirements, am I right?
What might a BA.2 surge in the U.S. look like?
Between the warning signals from Europe and the newly-lax safety measures throughout the U.S., it seems very likely that we will see a BA.2 surge in the coming weeks. The bigger question, though, is this surge’s severity: to what extent will it cause severe disease and death?
As I mentioned above, estimates suggest that about 40% to 45% of Americans have some Omicron antibodies from an infection earlier in the winter. At the same time, about 65% of the population is fully vaccinated and 45% of those fully vaccinated have received a booster shot, according to the CDC.
That’s a lot of people who are protected against severe COVID-19 symptoms, if they get infected with BA.2. But the U.S. has lower vaccination coverage than other countries, particularly when it comes to boosters. For example, in the U.K., 86% of eligible people are fully vaccinated and 67% are boosted, according to CNN. These lower vaccination rates contributed to the U.S.’s high mortality rate during the Omicron surge compared to other wealthy countries.
While the vaccines offer great protection, the U.S. appears to have given up on many other COVID-19 safety measures, like masks, social distancing, and limits on in-person gatherings. Without reinstating some of these measures, we would essentially be left without any tools to slow down the spread of BA.2; and even if some states and cities put safety measures in place, they’ll likely face more pushback now than they did in earlier surges.
To quote from Kissane’s newsletter:
In practical terms, with work and school happening in-person and without high-filtration (or any) masks or serious ventilation requirements in the US and most of Europe, governments in North America and Europe have made increased covid exposure essentially mandatory for most citizens.
I want to emphasize that for most vaccinated people, this increased risk probably won’t be a huge deal even if BA.2 causes a new case surge—they’ve either already racked up enough immunity to fight off BA.2 or they’ll be sick for a week.
One big caveat to this, though: we don’t have great data yet on how Omicron (or BA.2 specifically) might contribute to Long COVID rates; collecting data on this condition is very challenging and takes a lot of time. Studies suggest that vaccination reduces an individual’s risk of long-term symptoms if they get infected, but it does not eliminate this risk.
What can you do to prepare for this potential surge?
Here are a few things that I’m doing to prepare for a potential BA.2 surge in the coming weeks:
Promoting vaccination—particularly booster shots—to family members and friends.
Stocking up on good-quality masks (i.e. N95s and KN95s) and rapid tests. (Reminder, order a new round of free tests from covidtests.gov if you haven’t yet!)
Researching my options for COVID-19 treatments (antiviral pills and monoclonal antibodies) in the event that I get infected.
Getting tested frequently, particularly before attending indoor events (such as gathering with a few other friends, or going out to a movie theater.)
Watching wastewater and case trends in my area, and preparing to cut down on riskier behaviors if(/when) cases start rising.
I don’t know what BA.2 will mean for the US.
I do know this:
It hinges on vaccination/booster rates *now*.
So: 👆+
4th doses & Evusheld for immunocompromised ASAP, if not done.
Know where you’d get Paxlovid & Sotrovimab.
Order rapids now.
Get N95s or best possible now.
— Jeremy Faust MD MS (ER physician) (@jeremyfaust) March 16, 2022
As always, if you have any COVID-19 questions (about BA.2 or otherwise) that you’d like me to address, please reach out.
In the past week (March 12 through 18), the U.S. reported about 210,000 new COVID-19 cases, according to the CDC. This amounts to:
An average of 30,000 new cases each day
64 total new cases for every 100,000 Americans
17% fewer new cases than last week (March 5-11)
In the past week, the U.S. also reported about 16,000 new COVID-19 patients admitted to hospitals. This amounts to:
An average of 2,300 new admissions each day
4.9 total admissions for every 100,000 Americans
27% fewer new admissions than last week
Additionally, the U.S. reported:
7,400 new COVID-19 deaths (2.2 for every 100,000 people)
100% of new cases are Omicron-caused; 23% BA.2-caused (as of March 12)
An average of 100,000 vaccinations per day (per Bloomberg)
National COVID-19 case numbers are still falling, as we reach two months since the peak of the Omicron surge. The U.S. reported about 30,000 new cases each day last week, according to the CDC; that’s the lowest this number has been since last summer.
Hospitalization and death numbers are also still falling. The CDC reports that only 2,300 new COVID-19 patients were admitted to U.S. hospitals each day last week, compared to almost ten times that number at Omicron’s peak. Hospital systems in all 50 states and D.C. are currently labeled as “having capacity” on the Circuit Breaker Dashboard.
While this is all good news, it’s unclear how long this lull in cases will last. BA.2, the Omicron sister strain, is slowly outcompeting the original variant thanks to its even-more-transmissible capabilities: it’s gone from causing about 2% of new COVID-19 cases nationwide in the week ending February 12 to causing 23% of new cases in the week ending March 12, according to CDC estimates.
This strain is wreaking havoc in Asia and Europe, and U.S. experts are concerned that we may see a new surge in the coming weeks. Wastewater data may also suggest an oncoming surge, as a growing number of sewershed collection sites are reporting increases in their coronavirus levels. (More on this later in the issue.)
At the state level, a few places are beginning to see case increases: Washington, D.C., New York, Kentucky, Rhode Island, and Illinois all reported modest increases this week, according to the March 17 Community Profile Report. D.C. had the highest case increase, 20% more cases than the previous week. Some of these locations were also the first to be hit in the Omicron surge last December.
U.S. leaders should be taking advantage of this lull between surges to improve our preparedness: distribute masks and rapid tests, expand surveillance systems, and—most importantly—encourage people to get vaccinated so that they are protected when case rates rise again. Yet instead, Republicans in Congress are refusing to provide more public health funding, and the rate of Americans getting their first vaccine doses is lower than it has been since December 2020.
A couple of data sources, and a few data-related news items:
COVID-19 vaccine data annotations: Yesterday, I updated my annotations page on U.S. vaccination data sources for the first time in a few weeks. The page lists both national dashboards and vaccine data pages from all 50 state public health agencies, including notes on what each source offers. Going through the dashboards yesterday, I was struck by how many states are now offering data on booster shots (43, by my count), as well as how counts of doses distributed in a state, once a major feature of these dashboards, have become less useful now that the U.S. has ample vaccine supplies.
Order more free rapid tests from the federal government: The COVIDtests.gov site is now open for additional orders of free rapid at-home tests, as part of the federal program that launched in mid-January. Each household can now order two sets of four tests. I ordered a set of tests last Monday, and received them on Thursday—much faster than the initial round of this program!
Scientists are investigating combinations of Delta and Omicron: You might have seen some recent headlines about “Deltacron,” a portmanteau of the two variants of concern. When a very unlucky person gets infected with both Delta and Omicron at the same time, the variants can combine and form a new strain with genetic elements of both lineages. Scientists have recently identified a small number of “Deltacron” cases in France, Denmark, the Netherlands, and the U.S.; it’s not cause for major concern at this time, but is under study to determine if this combined strain might have any transmission or severity advantages. The Guardian has a good explainer on the subject.
New studies on masks, vaccines for kids: This week, the CDC MMWR published a new study on masking in K-12 schools; the researchers found that Arkansas school districts with a universal mask requirement in the fall 2021 semester had 23% lower cases than schools that did not have a requirement. The journal also published a new study on vaccinations in children ages 5 to 11; this study found that, within three months of COVID-19 vaccines becoming available for this age group, 92% of kids ages 5 to 11 lived within 5 miles of a vaccine provider. However, vaccination coverage in this age group is low, suggesting the need for more targeted communication to families with young kids.
NIH starts new trial on allergic reactions to vaccines: The National Institutes of Health (NIH) recently announced a new clinical trial to understand “rare but potentially serious systemic allergic reactions” to the COVID-19 vaccines. The trial will include up to 100 people between the ages of 16 and 69 who had allergic reactions to their first vaccine doses; the NIH will provide second doses under heavily monitored conditions and study how these patients respond.
How to better recruit for COVID-19 trials: Speaking of clinical trials, a new preprint posted this week to medRxiv outlines a potential strategy for better studying effectiveness and potential rare side effects of COVID-19 treatments. The preprint authors propose targeting recruitment to people who are high-risk for coronavirus infection, so that studies may collect data on a statistically significant number of cases more quickly.
COVID-19 at the Tokyo Olympics: Another study that caught my eye this week: researchers from Tokyo described the results of intensive surveillance testing for athletes who competed in the 2021 Tokyo Olympics and Paralympics. In total, among over one million PCR tests conducted before and during the Olympic games, just 299 returned positive results—a positivity rate of 0.03%.
COVID-19 on Capitol Hill: Reporters at The Hill analyzed data on COVID-19 test results among House and Senate lawmakers, finding that more than one-quarter have tested positive since the pandemic began. The highest case numbers occurred in January 2022 during the Omicron wave, aligning with the U.S. overall. (Though I imagine many legislators travel and socialize indoors more than the average American.)