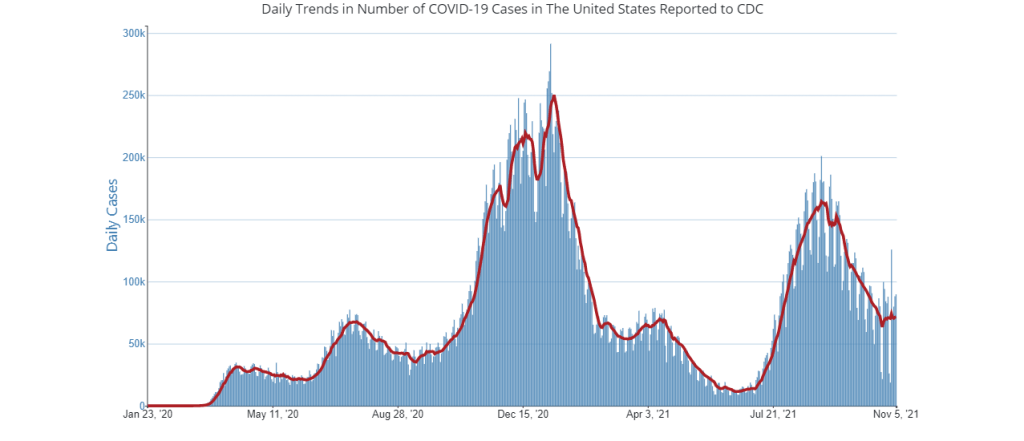

In the past week (November 17 through 23), the U.S. reported about 310,000 new COVID-19 cases, according to the CDC. This amounts to:
- An average of 44,000 new cases each day
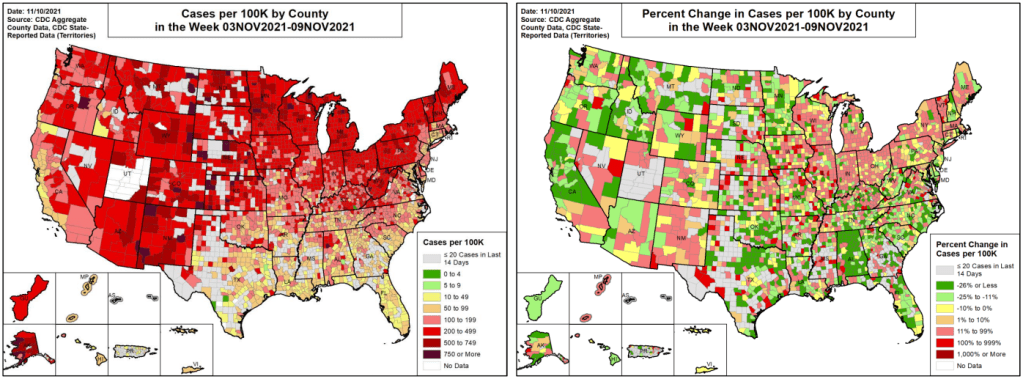
- 93 total new cases for every 100,000 Americans
- 8% more new cases than last week (November 10-16)
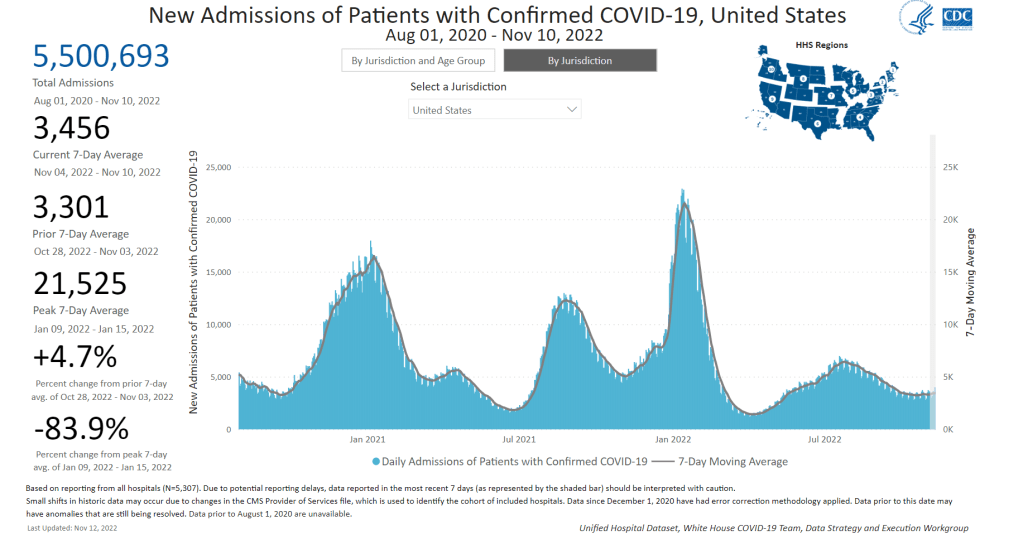
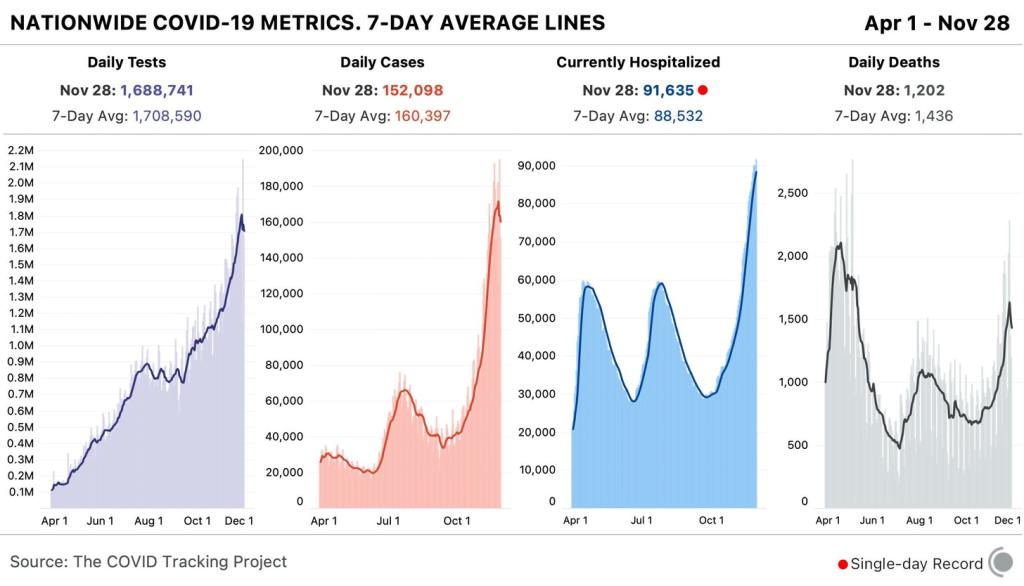
In the past week, the U.S. also reported about 24,000 new COVID-19 patients admitted to hospitals. This amounts to:
- An average of 3,400 new admissions each day
- 7.2 total admissions for every 100,000 Americans
- 0.2% more new admissions than last week
Additionally, the U.S. reported:
- 2,600 new COVID-19 deaths (380 per day)
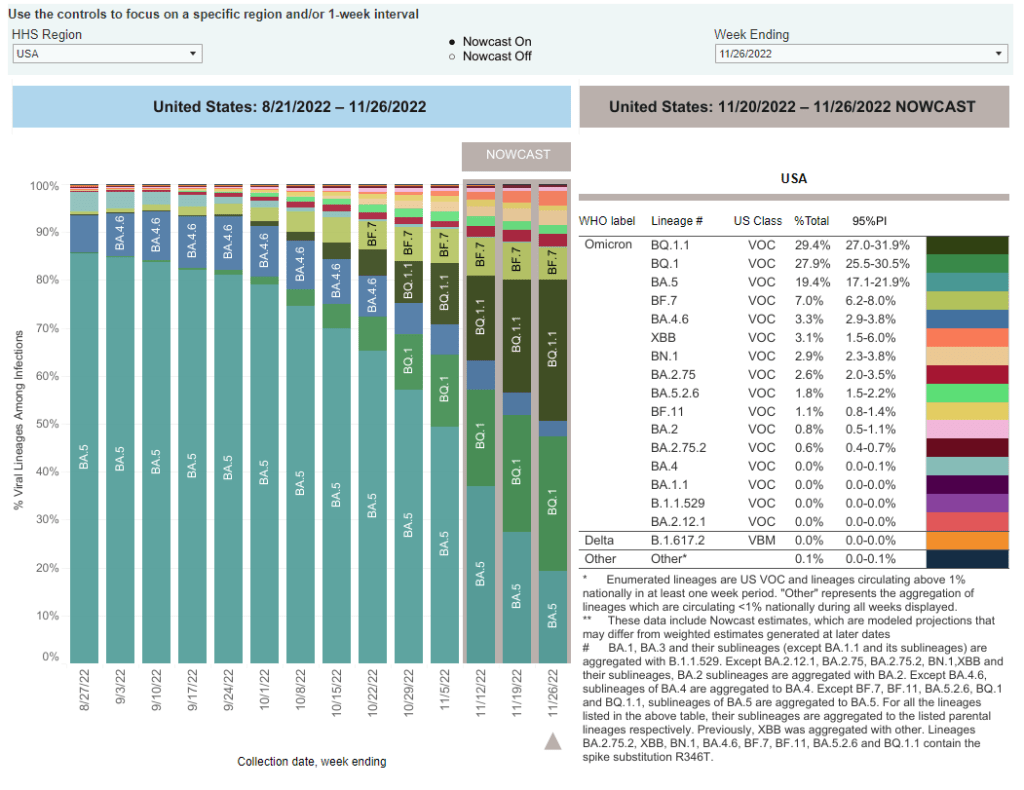
- 57% of new cases are caused by Omicron BQ.1 and BQ.1.1; 7% by BF.7; 3% by BN.1; 3% by XBB (as of November 26)
- An average of 300,000 vaccinations per day
Nationwide, reported COVID-19 cases went up last week: the CDC reports 8% more cases in the week ending November 23 than in the week ending November 16. Wastewater monitoring also suggests a pre-Thanksgiving uptick, according to Biobot, while new hospitalizations have been at a plateau.
All eyes will be on wastewater data in the next couple of weeks, to look for potential spread after Thanksgiving travel and gatherings. We likely won’t see any immediate spikes in case data thanks to the data delays that always happen after holidays, but wastewater surveillance is less susceptible to these delays (and less biased by behavioral patterns). To look for wastewater data in your community, see the COVID-19 Data Dispatch’s resource page.
Any outbreaks we see in the coming weeks will likely be driven by newer coronavirus variants, combining forces with holiday behavior. Omicron subvariants BQ.1 and BQ.1.1 caused about 57% of new COVID-19 cases in the week ending November 26, according to CDC estimates; the BQ lineage is more transmissible than its parent variant, BA.5, though it has not caused major case spikes in the U.S. yet.
The CDC’s latest variant update also provides estimates on XBB, a subvariant that evolved from BA.2 and that has caused new surges in some Asian countries. XBB caused about 3% of new cases in the last week, the agency estimates, with higher prevalence in the Northeast and West coast. Health officials are closely watching XBB due to the many mutations on its spike protein, but it’s unclear whether this subvariant alone could cause a new surge.
As we watch for new COVID-19 outbreaks, healthcare systems—especially children’s hospitals— across the country are already facing intense pressure from the flu, RSV, and other respiratory viruses. Many states, particularly on the East coast and in the South, continue to report very high levels of influenza-like activity, according to the CDC.
If you took part in a Thanksgiving gathering over the last few days: this week, you should look out for any respiratory symptoms and consider getting a PCR test, if you can. If possible, get a test that will check for COVID-19, the flu, and RSV at once. Make sure any disease spread stops with you!