
In the past week (April 16 through 22), the U.S. reported about 300,000 new COVID-19 cases, according to the CDC. This amounts to:
- An average of 43,000 new cases each day
- 91 total new cases for every 100,000 Americans
- 35% more new cases than last week (April 9-15)
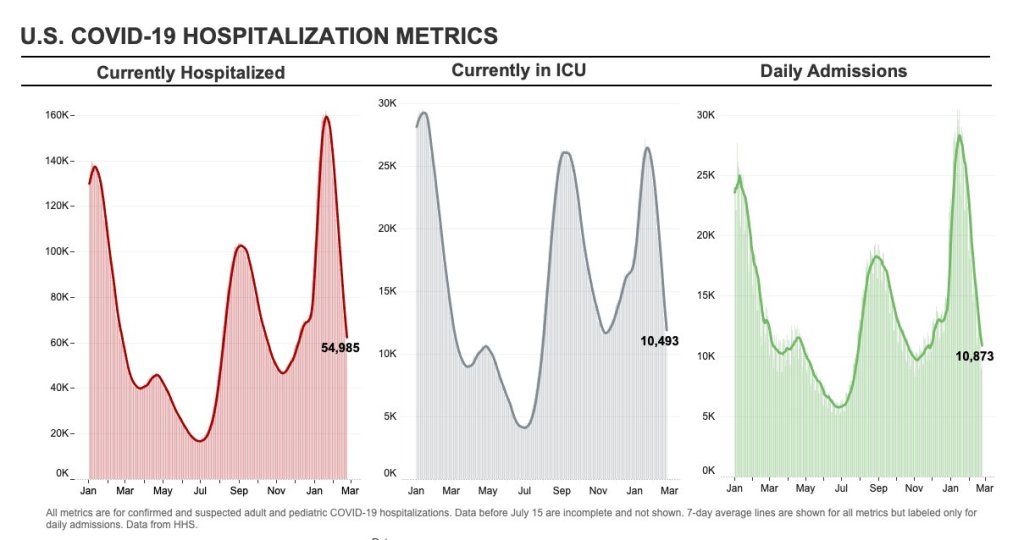
In the past week, the U.S. also reported about 11,000 new COVID-19 patients admitted to hospitals. This amounts to:
- An average of 1,600 new admissions each day
- 3.4 total admissions for every 100,000 Americans
- 8% more new admissions than last week
Additionally, the U.S. reported:
- 2,600 new COVID-19 deaths (0.8 for every 100,000 people)
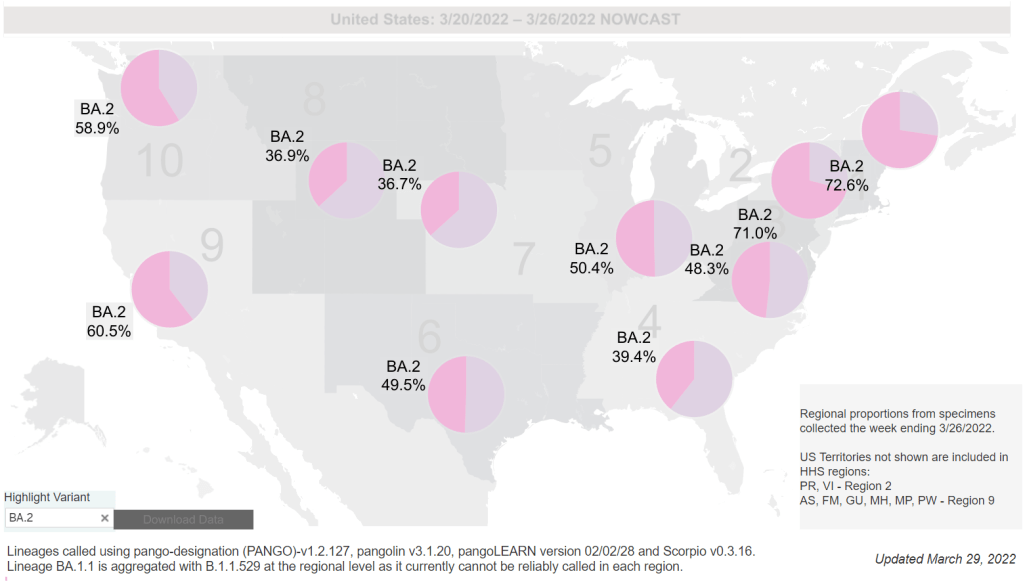
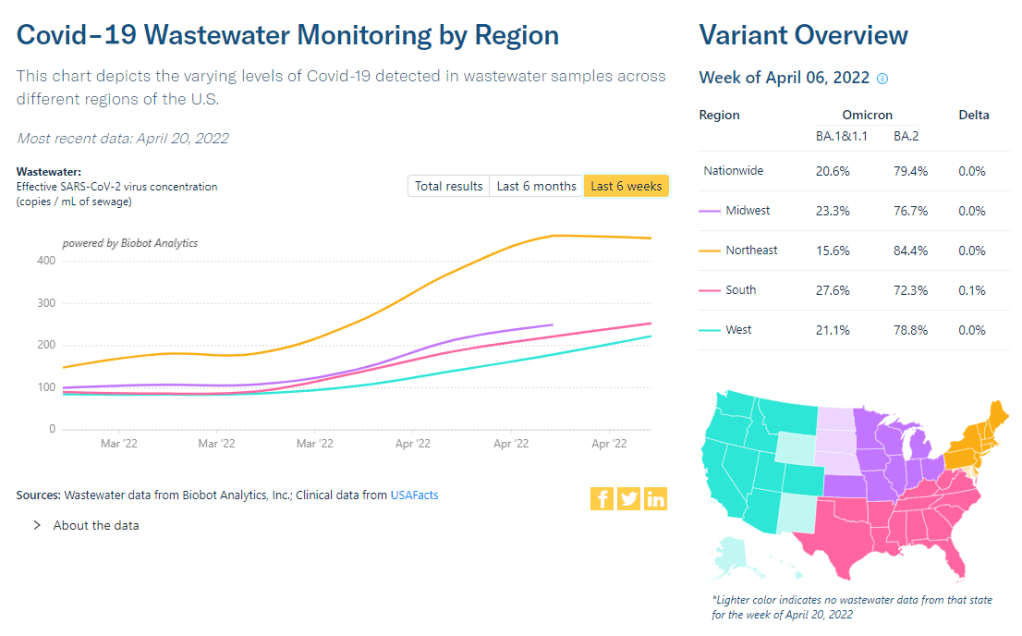
- 93% of new cases are Omicron BA.2-caused; 19% BA.2.12.1-caused (as of April 16)
- An average of 100,000 vaccinations per day (per Bloomberg)
After weeks of me warning about it, a BA.2 surge is upon us. Nationwide, new COVID-19 cases have gone up for the third week in a row; we’ve seen a 68% increase since the last week of March.
And that’s just the reported cases: Americans may be doing about four times more at-home tests than they’re doing lab-based PCR tests, according to Mara Aspinall, a COVID-19 testing expert (who cowrites a testing-focused newsletter). The vast majority of these at-home tests are never reported to public health officials and don’t make it into our trends analysis.
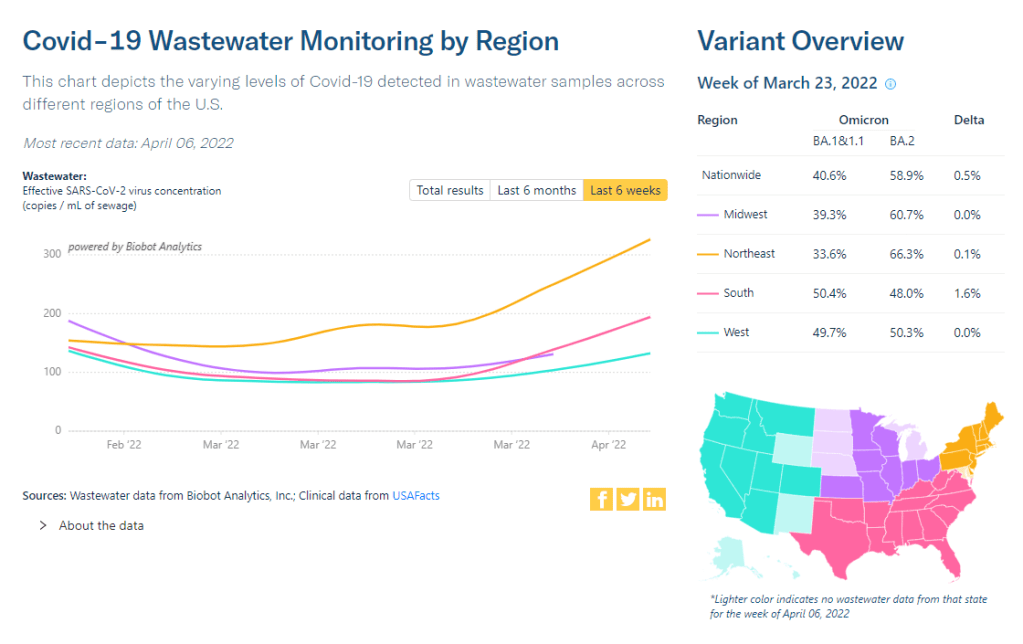
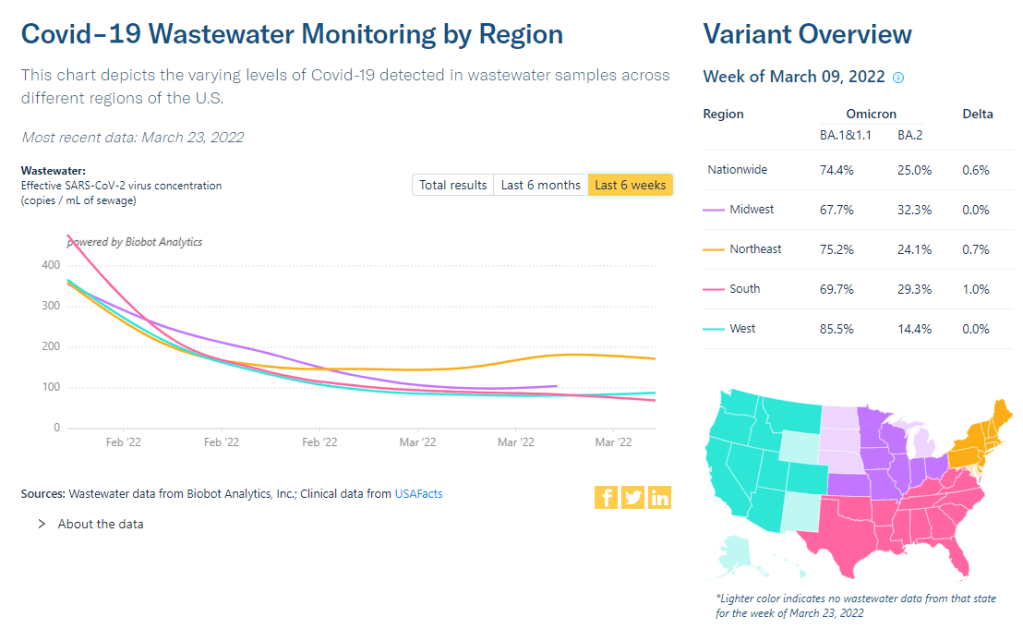
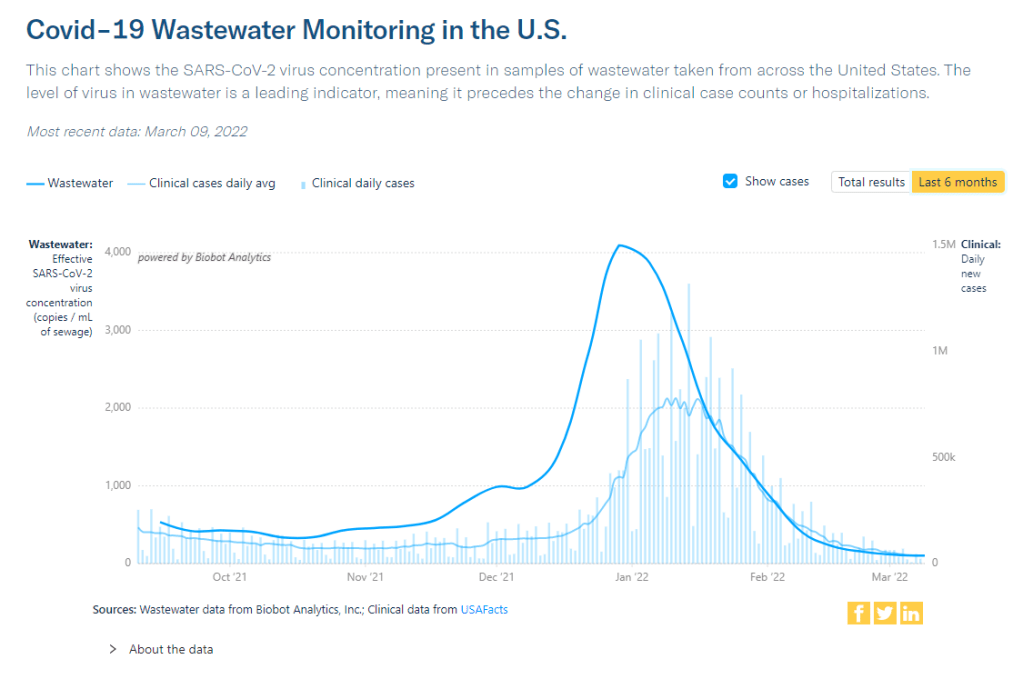
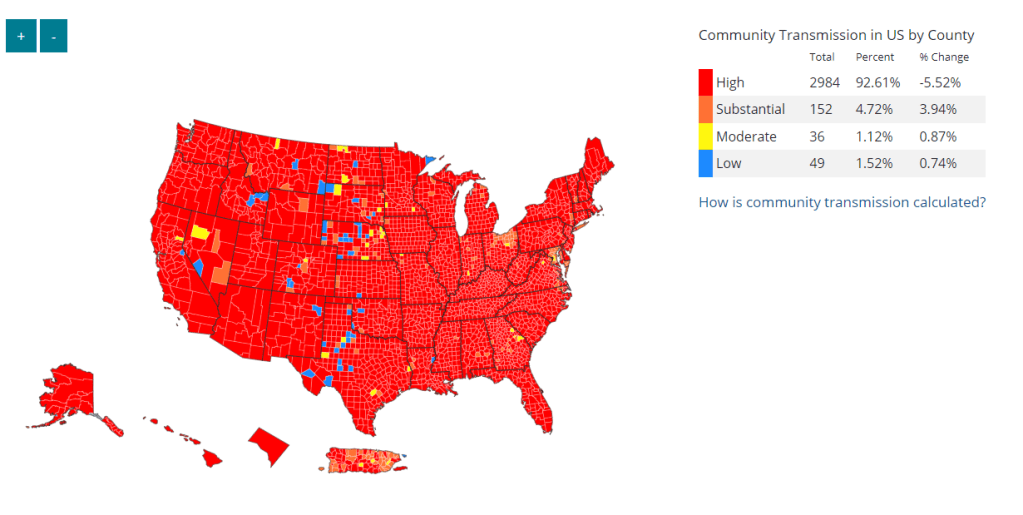
But there are other metrics that similarly indicate a national rise in coronavirus transmission. Viral levels in wastewater are going up, according to both Biobot’s tracker and the CDC’s national monitoring system; the CDC’s COVID-19 data team noted in this Friday’s Weekly Review that “more than half of all sites reporting wastewater data are experiencing a modest increase in SARS-CoV-2 levels.” Some of these increases are going from very low to still low, but they’re still worth watching.
The U.S. is also reporting an increase in new COVID-19 patients admitted to hospitals: about 11,000 people this week, up from 10,000 last week. New hospitalizations lag behind cases slightly, but they are a more reliable metric, as anyone with symptoms severe enough to require hospitalization generally will seek care (so, underreporting is less of a concern.)
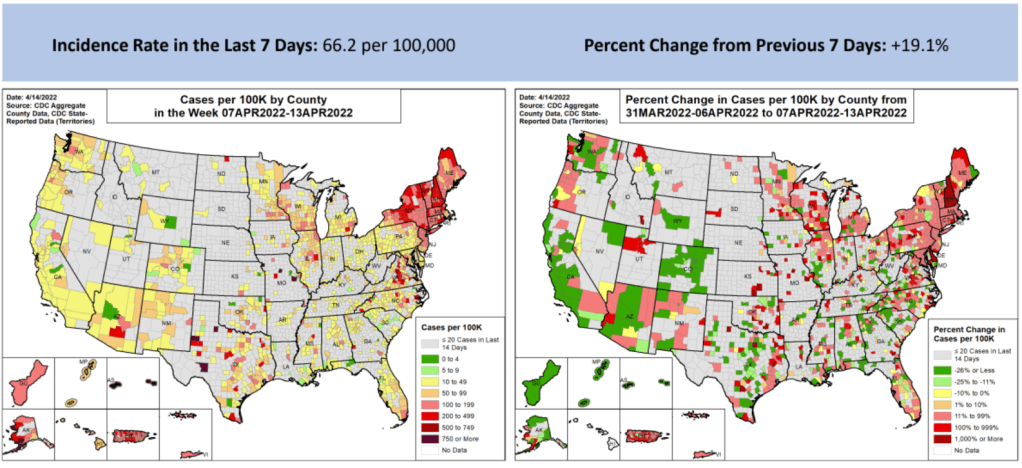
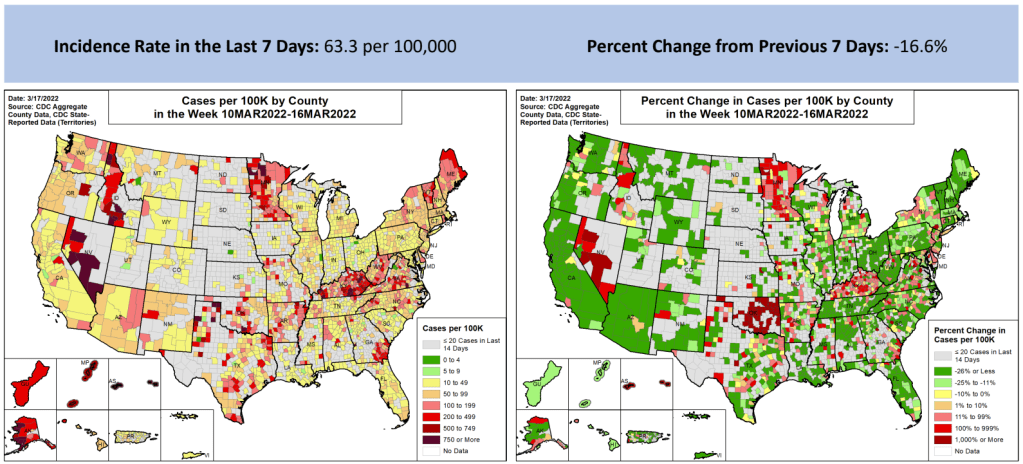
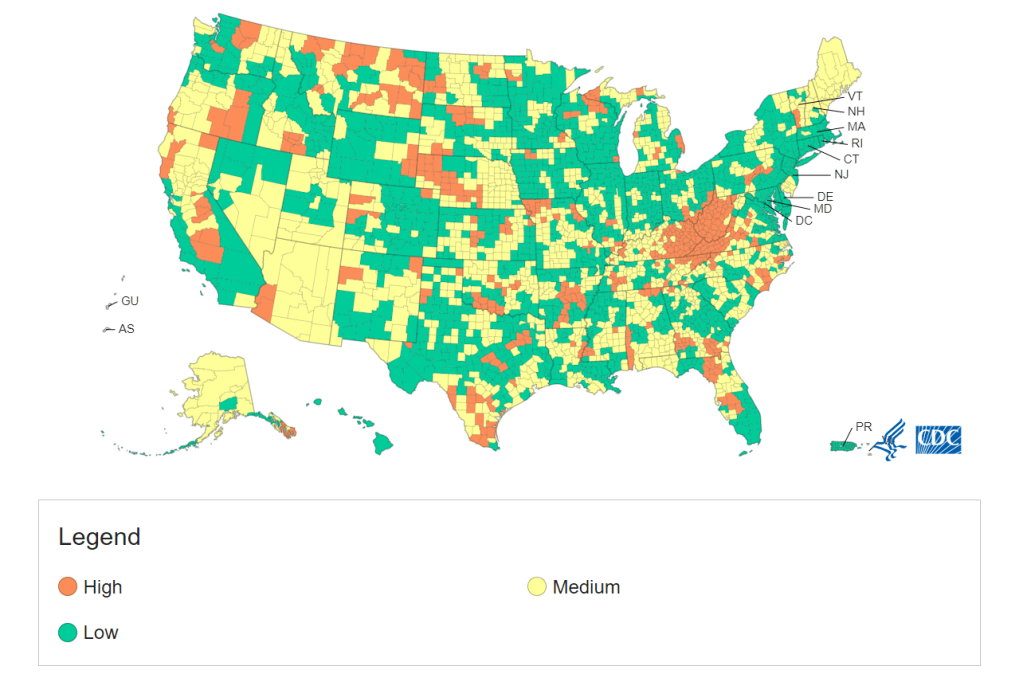
At the regional level, the Northeast is still seeing the highest case rates: leading jurisdictions include Vermont, Washington D.C., New York, Rhode Island, and Massachusetts, according to the April 21 Community Profile Report. The Northeast—particularly New York and New Jersey—is also a hotspot for the Omicron sub-subvariant, BA.2.12.1.
As I wrote last week, the New York State Department of Health recently identified new mutations of BA.2; BA.2.12.1 in particular seems to be even more transmissible than that BA.2 (which is, in itself, more transmissible than the original Omicron variant, BA.1). The CDC has added this sublineage to its variant tracking page, and estimates that BA.2.12.1 caused about one in five new COVID-19 cases nationwide in the week ending April 16.
To borrow an analogy from my sister (an engineering student): the emergence of these new Omicron sublineages feels like when you’re trying to do a problem set that claims to have five problems, but then each problem has several sub-problems, and those sub-problems themselves have more sub-problems. In the coming weeks, we’ll see just how much more transmissible Omicron can get.
There’s some good news, though: cases in some parts of the Northeast might be plateauing. It’s hard to tell for sure because of the aforementioned unreliable data, but wastewater data for the region (as well as for individual cities like Boston) seem to be leveling off; we’ll see next week if this trend continues.