
In the past week (January 12 through 18), the U.S. officially reported about 330,000 new COVID-19 cases, according to the CDC. This amounts to:
- An average of 47,000 new cases each day
- 101 total new cases for every 100,000 Americans
- 24% fewer new cases than last week (January 5-11)
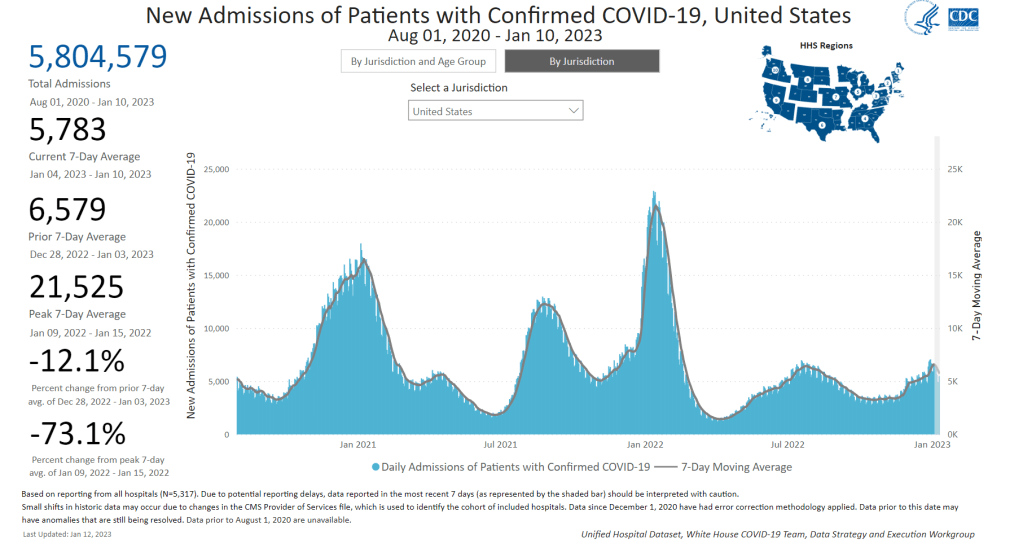
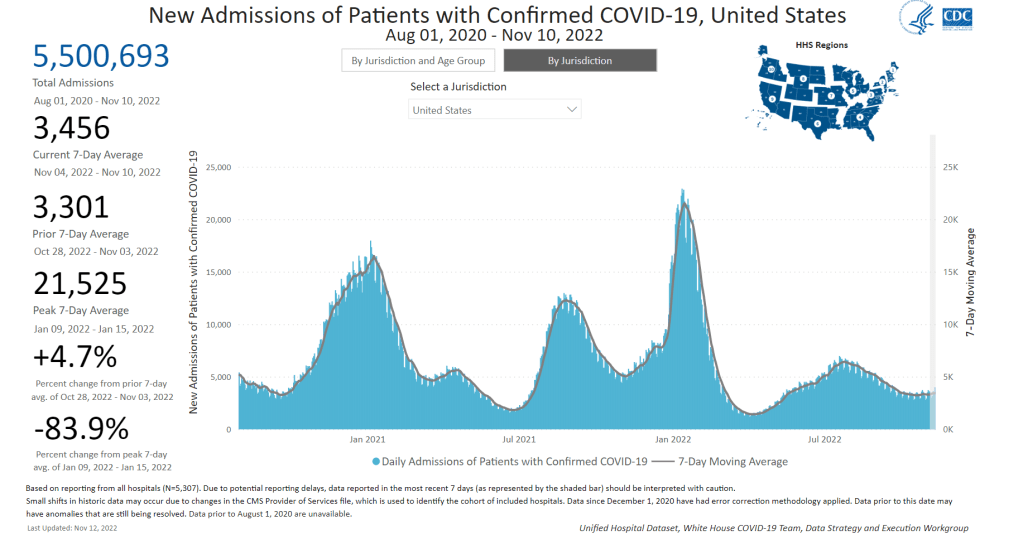
In the past week, the U.S. also reported about 35,000 new COVID-19 patients admitted to hospitals. This amounts to:
- An average of 5,000 new admissions each day
- 10.7 total admissions for every 100,000 Americans
- 16% fewer new admissions than last week
Additionally, the U.S. reported:
- 4,000 new COVID-19 deaths (560 per day)
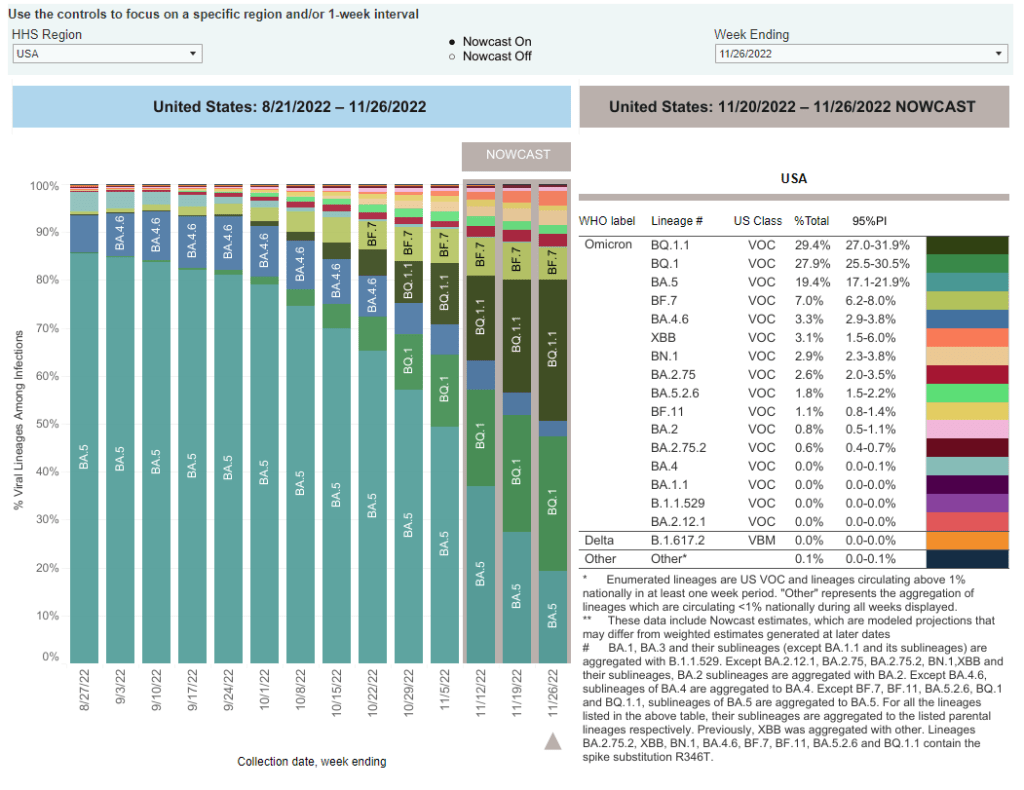
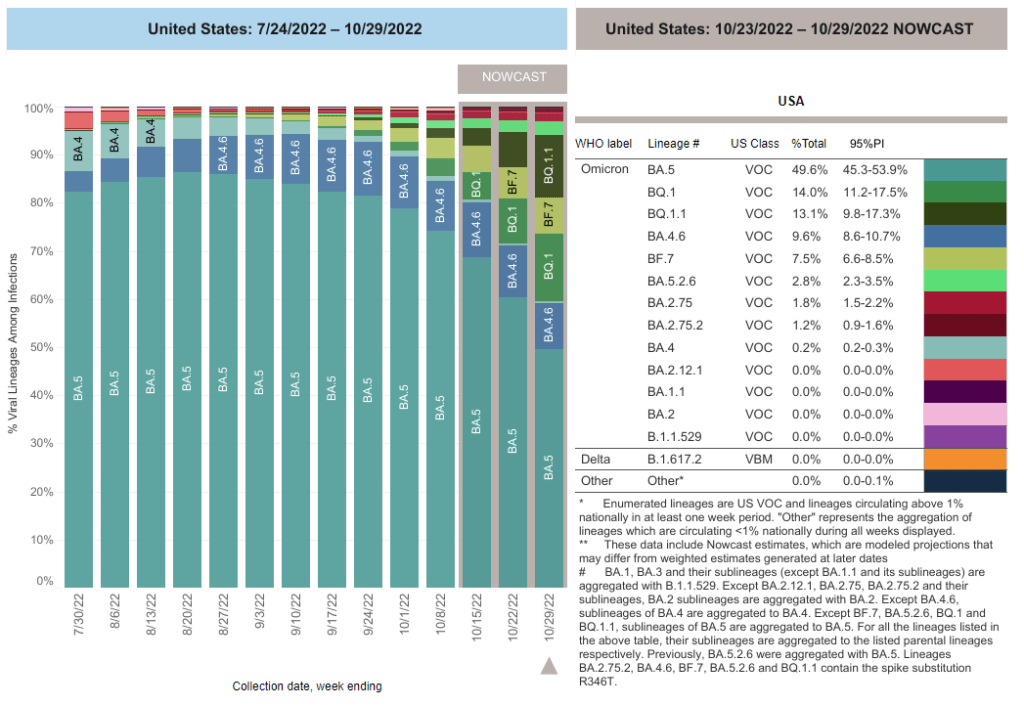
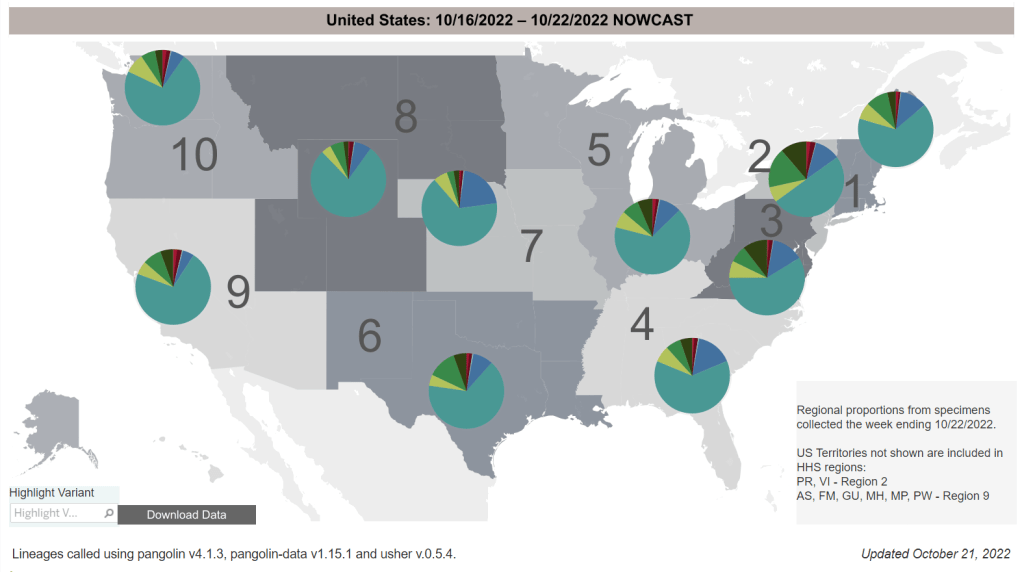
- 49% of new cases are caused by Omicron XBB.1.5; 40% by BQ.1 and BQ.1.1 (as of January 21)
- An average of 150,000 vaccinations per day (CDC link)
National COVID-19 metrics continue to suggest that the U.S. is coming out of its holiday surge, though some parts of the country may face increased transmission as the Omicron variant XBB.1.5 spreads.
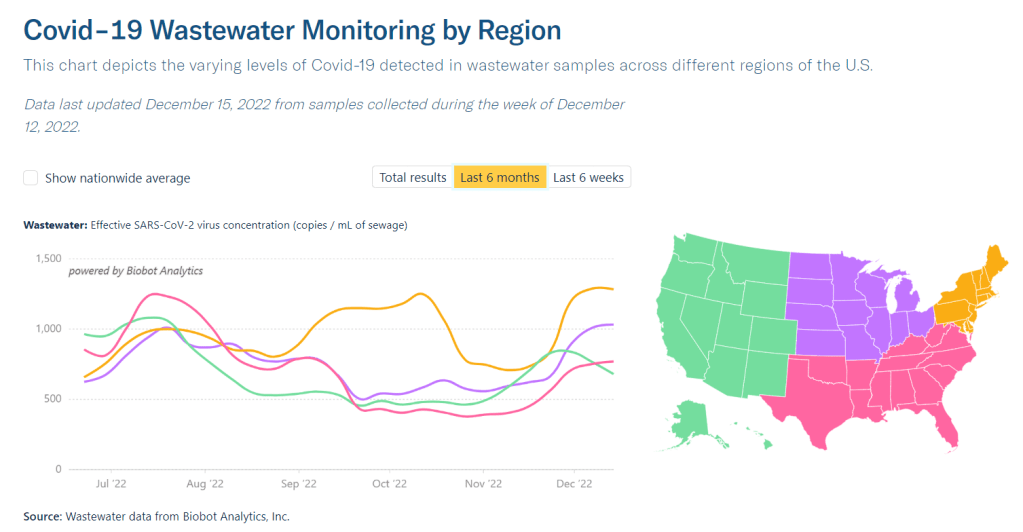
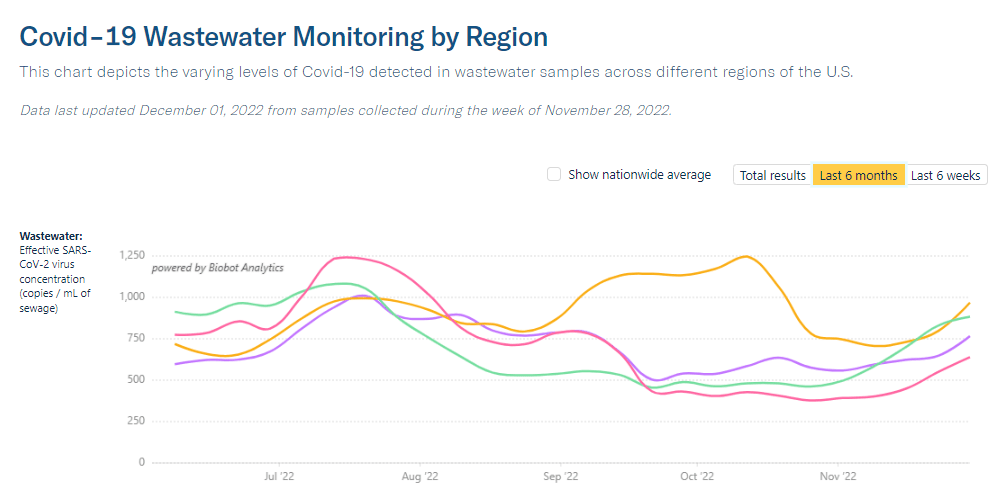
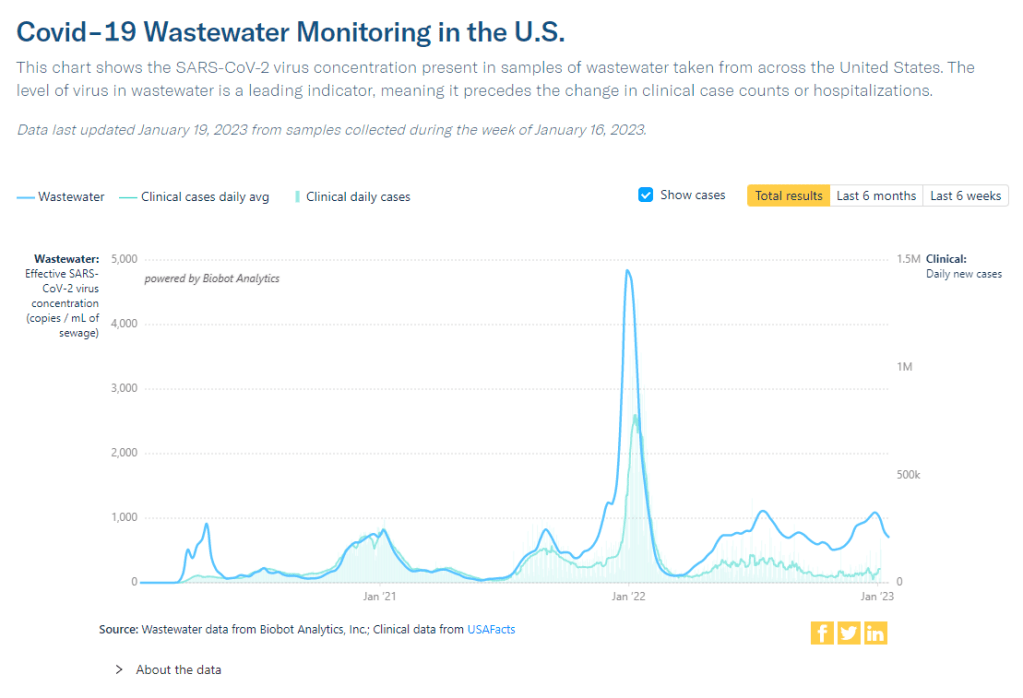
Official COVID-19 case numbers and new hospital admissions both reported declines this week, according to the CDC (of 24% and 16% respectively, compared to the prior week). Biobot’s wastewater surveillance data also show a decline, with coronavirus concentration at a similar level to mid-November 2022, just before Thanksgiving.
This trend is fairly consistent across states and regions, according to case and hospitalization data from the latest HHS Community Profile Report. However, Biobot’s regional and county-level data suggest that COVID-19 spread is in a plateau or even starting to increase in some parts of the South and Midwest regions.
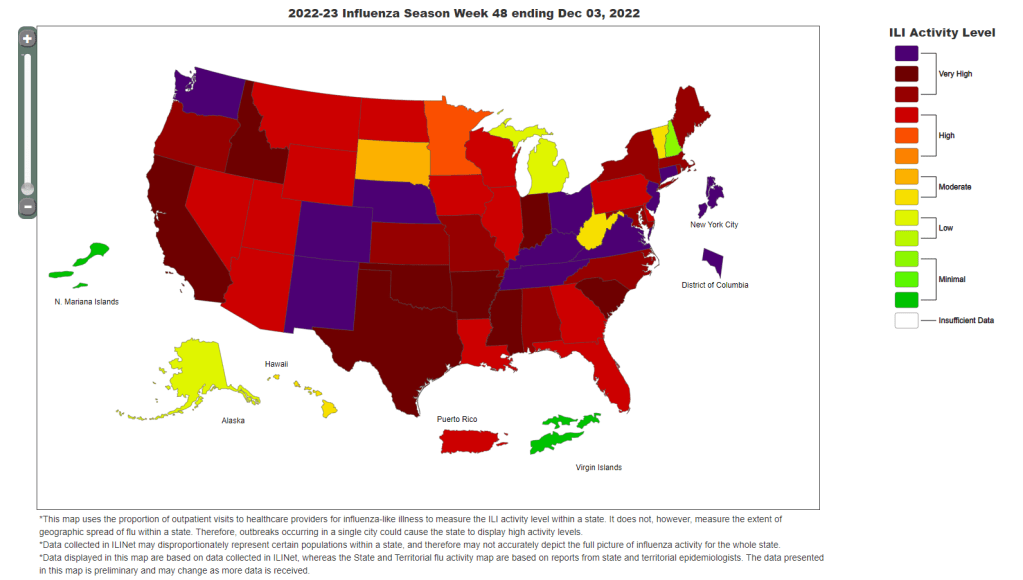
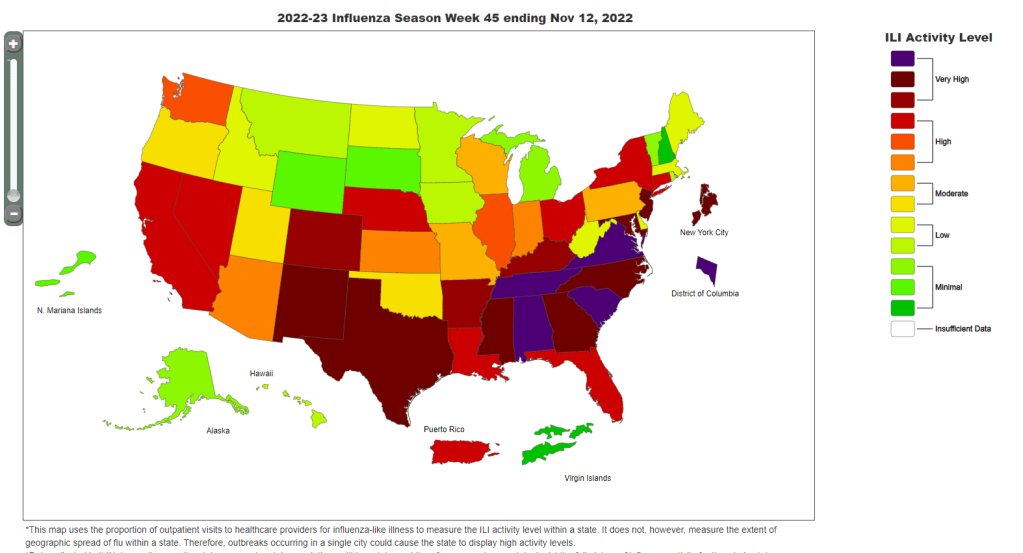
Hospitalizations for the flu and RSV are following a similar pattern to COVID-19, according to a new CDC dashboard that reports on all three illnesses together. Almost all states reported moderate or low levels of influenza-like activity in the week ending January 14, very different from the patterns we were seeing a few weeks ago. The only areas still reporting high influenza-like activity are California, North Dakota, New Mexico, Texas, Puerto Rico, New York City, and Washington D.C.
All of this is good news, suggesting that the worst of this winter’s respiratory virus surges may be behind us. But COVID-19 is still spreading across the country at fairly high levels, reflecting the high baseline that the U.S. has faced ever since new Omicron subvariants started to hit in spring 2022.
We also need to continue watching XBB.1.5, the latest and most contagious version of Omicron. This subvariant caused about half of new cases in the U.S. in the last week, according to CDC estimates. It’s most prevalent in the Northeast but is quickly gaining ground in the Southeast and other regions. (And the BQ lineages that currently dominate these regions can spread quickly, too.)
In the coming weeks, we’ll see how much XBB.1.5 (and any other variants) contribute to increased transmission in these regions. Meanwhile, COVID-19 deaths went up recently as the holiday surge took its toll: more than 500 people have died from COVID-19 every day in the last two weeks. Deaths are always the most delayed—and the most tragic—metric.