Tag: July data

  • National numbers, July 31

    National numbers, July 31

    New hospital admissions for COVID-19 are slowing nationwide, a potential sign of the subvariant surge peaking. Chart via the CDC, retrieved on July 31.

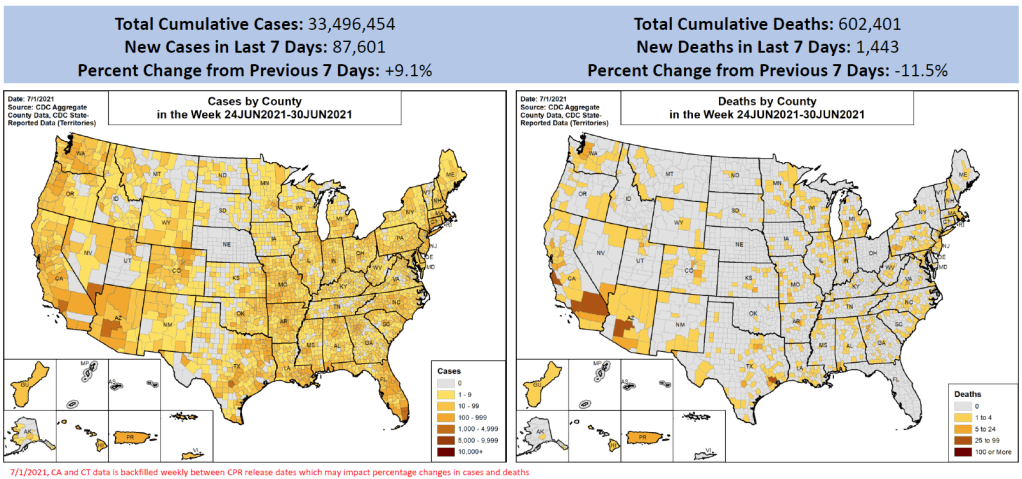
    In the past week (July 23 through 29), the U.S. reported about 880,000 new COVID-19 cases, according to the CDC. This amounts to:

    • An average of 130,000 new cases each day
    • 269 total new cases for every 100,000 Americans
    • 1% fewer new cases than last week (July 16-22)

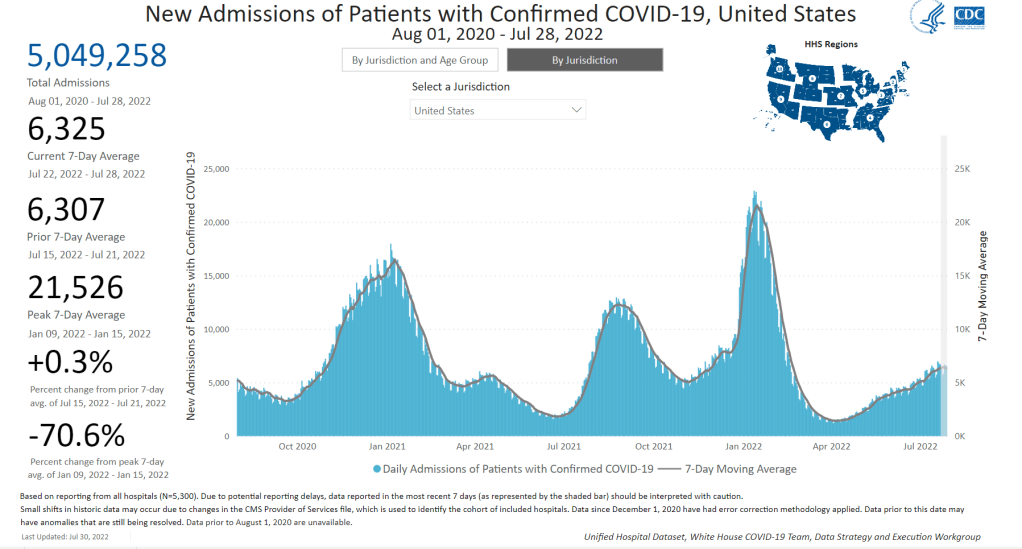
    In the past week, the U.S. also reported about 44,000 new COVID-19 patients admitted to hospitals. This amounts to:

    • An average of 6,300 new admissions each day
    • 13.5 total admissions for every 100,000 Americans
    • 2% more new admissions than last week

    Additionally, the U.S. reported:

    • 2,500 new COVID-19 deaths (0.8 for every 100,000 people)
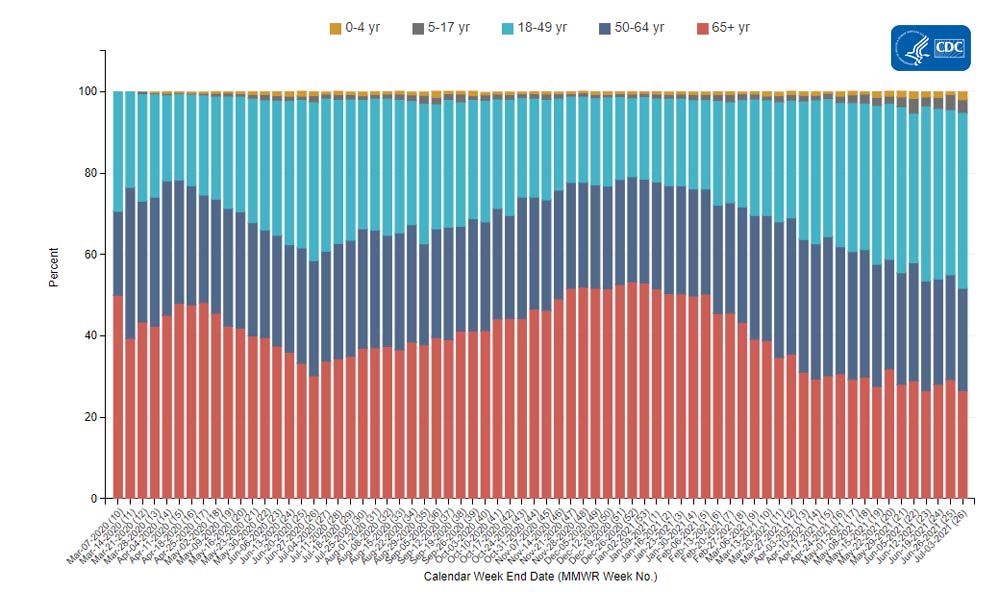
    • 82% of new cases are caused by Omicron BA.5; 13% by BA.4 (as of July 23)
    • An average of 100,000 vaccinations per day (per Bloomberg)

    The U.S.’s Omicron BA.5 wave appears to be creeping past its plateau, according to several major indicators. Nationwide, 1% fewer new cases were reported this week compared to last week, the second week in a row of clear deceleration in this metric (with no major holidays interrupting reports).

    New hospital admissions are also slowing down: the number of COVID-19 patients newly admitted to hospitals this week was only 2% higher than it was last week. It’s a smaller increase than any reported week-over-week in the last couple of months.

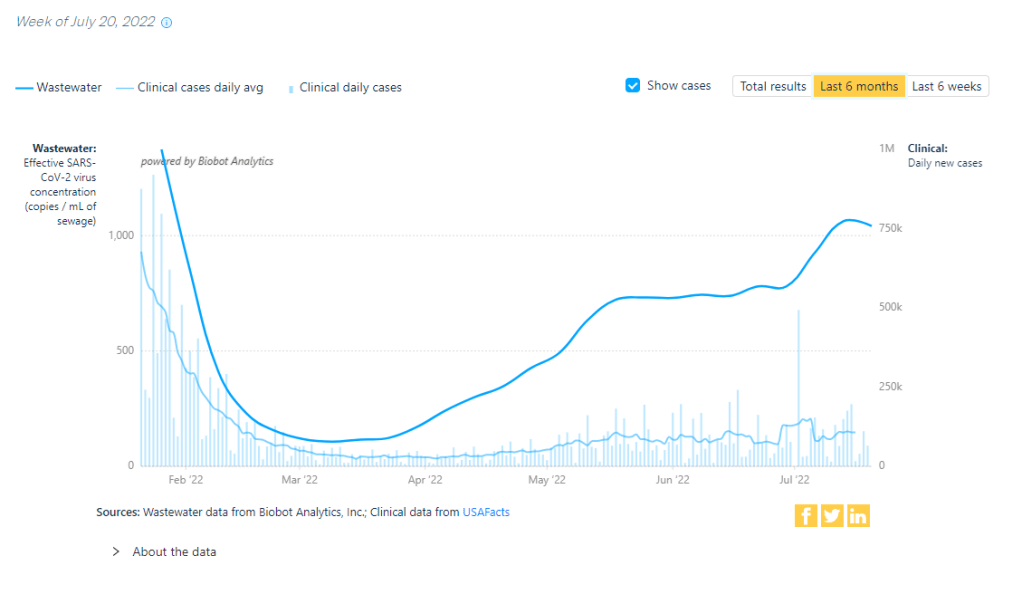
    And the plateau is showing up in wastewater, too: data from Biobot Analytics show that the coronavirus concentration in America’s sewers dipped slightly last week in all four regions of the country. About 55% of sewersheds in the CDC’s wastewater surveillance network reported coronavirus decreases or very slight increases in the last week, compared to 45% reporting more significant increases.

    To me, these metrics are suggesting that the Omicron subvariant wave may be, finally, running out of people to infect (or reinfect). But the decline is incredibly slow, likely because the U.S. has taken almost no measures to curb transmission.

    The CDC’s community transmission guidance (also known as the old guidance, pre-February 2022 switch to “Community Levels”) suggests that Americans in 98% of counties should be masking indoors right now. But almost no state or local public health departments have actually brought back mask requirements. Even Los Angeles County failed to institute its planned indoor mask mandate, due to public pushback at the measure and cases trending down.

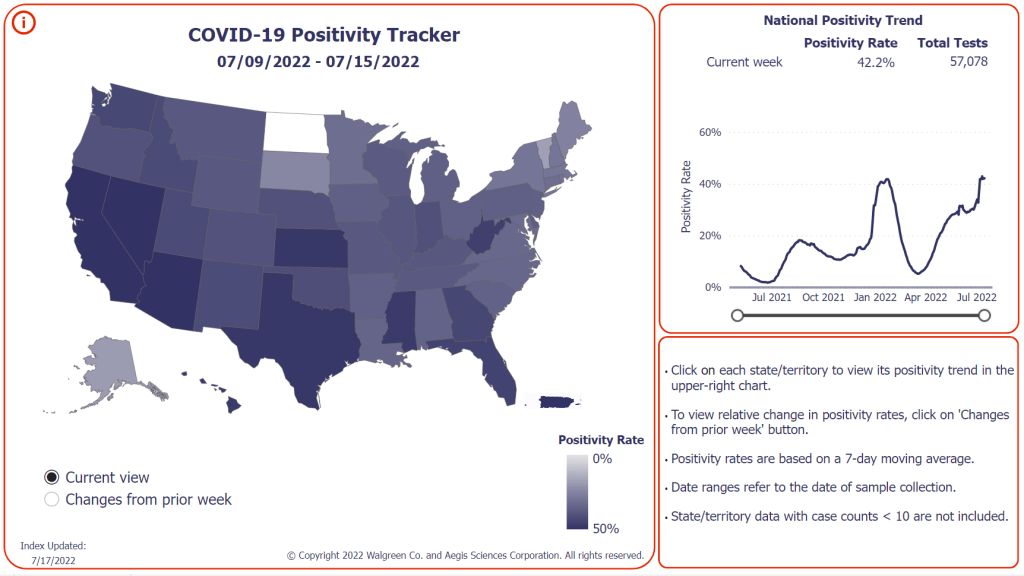
    Meanwhile, testing indicators continue to suggest that reported case counts are a small fraction of the actual coronavirus infections happening across the country right now. The national PCR test positivity rate was 18% last week, according to the CDC; and almost every state reported a positivity rate over 10%, according to the July 28 Community Profile Report. (Experts consider test positivity over 10% to be evidence of high transmission and insufficient testing.)

    As fewer PCR tests are conducted, the companies that process these tests are laying off workers and cutting their capacity, according to the Wall Street Journal. Even some companies that make at-home rapid tests are taking these measures, though rapid test capacity is still much higher than PCR testing capacity right now.

    The safety measures that can prevent coronavirus transmission have not changed with BA.5. Individuals and small communities still have the ability to keep using masks, testing, gathering in outdoor spaces, etc., even as our institutions fail to keep us safe.

  • National numbers, July 24

    National numbers, July 24

    Has the BA.5 surge reached a plateau? Data from wastewater and other sources seem to suggest, maybe. Chart via Biobot Analytics.

    In the past week (July 16 through 22), the U.S. reported about 880,000 new COVID-19 cases, according to the CDC. This amounts to:

    • An average of 130,000 new cases each day
    • 268 total new cases for every 100,000 Americans
    • 1% more new cases than last week (July 9-15)

    In the past week, the U.S. also reported about 43,000 new COVID-19 patients admitted to hospitals. This amounts to:

    • An average of 6,200 new admissions each day
    • 13.2 total admissions for every 100,000 Americans
    • 5% more new admissions than last week

    Additionally, the U.S. reported:

    • 2,400 new COVID-19 deaths (0.7 for every 100,000 people)
    • 78% of new cases are caused by Omicron BA.5; 13% by BA.4 (as of July 16)
    • An average of 100,000 vaccinations per day (per Bloomberg)

    Reported COVID-19 cases and hospital admissions seem to suggest that maybe the BA.5 surge is slowing down, at the national level. (And it is, definitively, the BA.5 surge, with almost 80% of new cases caused by this subvariant in the week ending July 16). According to CDC data, new cases only increased by 1% this week, compared to the week prior; last week, they increased by 17%.

    New hospital admissions, similarly, increased by 5% this week, compared to 15% the week prior. And wastewater data from Biobot are showing a potential national plateau in the last week, with very slight increases or decreases in all four main regions of the country.

    The CDC’s wastewater monitoring also shows that “most of the country is reporting moderate to high SARS-CoV-2 levels in wastewater.” About half of the 800 sites in the CDC network reported a decrease in coronavirus levels in the last two weeks, while 43% reported an increase.

    These are all good signs. But I’m skeptical that we’re anywhere near the end of this current surge, for a few reasons. First, the continued underreporting of cases makes it difficult to evaluate case data, both nationally and in local settings. (For example, is NYC actually seeing a decline in transmission, or is the recent decline there a result of less PCR testing?) The CDC reported a national PCR test positivity of 17% last week, and it’s even higher in many states.

    Second, the declines we’re seeing in hospital admissions and coronavirus levels in wastewater—both more reliable indicators than cases—are very slight. These patterns suggest that, while we may be near the peak of the BA.5 surge, it could take several weeks for it to actually abate. And by the time that happens, another new variant (maybe BA.2.75, maybe something else entirely) could likely come in and bump transmission again.

    Finally, the U.S. as a whole is doing very little to manage this surge. I think this subheading from a recent POLITICO Pro article provides a good summary of the situation: “Strategies for managing 130,000 new daily Covid cases are largely the same as they were for managing 30,000 new daily cases four months ago.”

    There’s been a slight uptick in second booster shots for Americans over age 50, according to CDC data. And a few, isolated localities are considering new mask mandates. But by and large, most people are heading into potential reinfection from BA.5 with limited protection. Stay safe out there.

  • National numbers, July 17

    National numbers, July 17

    More than 40% of COVID-19 tests conducted at Walgreens pharmacies in the last week came back positive. This is not a good indicator, to put it mildly.

    In the past week (July 9 through 15), the U.S. reported about 870,000 new COVID-19 cases, according to the CDC. This amounts to:

    • An average of 120,000 new cases each day
    • 265 total new cases for every 100,000 Americans
    • 16% more new cases than last week (July 2-8)

    In the past week, the U.S. also reported about 41,000 new COVID-19 patients admitted to hospitals. This amounts to:

    • An average of 5,900 new admissions each day
    • 12.5 total admissions for every 100,000 Americans
    • 14% more new admissions than last week

    Additionally, the U.S. reported:

    • 2,500 new COVID-19 deaths (0.8 for every 100,000 people)
    • 65% of new cases are caused by Omicron BA.5; 16% by BA.4 (as of July 9)
    • An average of 80,000 vaccinations per day (per Bloomberg)

    As I suspected last week, the small dip in official COVID-19 case numbers was a result of the July 4 holiday, not an actual decline in transmission. This week, cases are up again nationwide, with the highest number reported since early February.

    Of course, PCR testing capacity has declined substantially since February. And test positivity rates are high across the country: the CDC reported a nationwide rate of 17.5%, while the Walgreens COVID-19 Index (which compiles data from testing at Walgreens pharmacies) reports a rate of 42%. Such high positivity numbers indicate that our official case data are capturing a small fraction of cases.

    And we have other indicators of the substantial COVID-19 spread happening right now. Biobot’s wastewater tracker reports increased transmission nationwide and in all four regions in the last two weeks. Over half of sewershed sites in the CDC’s National Wastewater Surveillance System reported increases in the two weeks ending July 11—and for about one-third of sites, those increases were more than 100%.

    New hospital admissions of COVID-19 patients went up by 14% last week, similarly to the highest levels reported since February. Reports of COVID-19 symptoms are also on the upswing, according to survey data collected by the Delphi Group at Carnegie Mellon University.

    While some hospitalization metrics and deaths may be low at the moment, remember that these are lagging indicators: they go up a few weeks after cases. And cases are definitely going up right now, driven by the Omicron subvariant BA.5—which is now dominant in the country.

    BA.5 and BA.4 together caused more than 80% of new COVID-19 cases in the week ending July 9, according to CDC estimates. BA.5 is pulling ahead, though, readily reinfecting people in a national climate that seems to have largely given up on safety measures.

    But measures like masking, testing, and booster shots can still reduce transmission. I was heartened this week to see Los Angeles County preparing for a new indoor mask mandate in response to rising cases; other places should follow this lead.

  • National numbers, July 10

    National numbers, July 10

    Almost the entire country is currently experiencing high COVID-19 transmission, according to the old CDC guidance. And that’s just the cases we know about.

    In the past week (July 2 through 8), the U.S. reported about 750,000 new COVID-19 cases, according to the CDC. This amounts to:

    • An average of 110,000 new cases each day
    • 227 total new cases for every 100,000 Americans
    • 4% fewer new cases than last week (June 25-July 1)

    In the past week, the U.S. also reported about 36,000 new COVID-19 patients admitted to hospitals. This amounts to:

    • An average of 5,000 new admissions each day
    • 10.8 total admissions for every 100,000 Americans
    • 3% more new admissions than last week

    Additionally, the U.S. reported:

    • 1,900 new COVID-19 deaths (0.6 for every 100,000 people)
    • 27% of new cases are Omicron BA.2.12.1-caused; 70% BA.4/BA.5-caused (as of July 2)
    • An average of 150,000 vaccinations per day (per Bloomberg)

    Our prolonged Omicron subvariant surge continues, now dominated clearly by BA.5. While reported COVID-19 cases dipped slightly last week at the national level, this is almost certainly a result of the July 4 holiday rather than an actual slowing in coronavirus transmission.

    As evidence, note that the number of COVID-19 patients newly reported to hospitals—a metric less impacted by holidays—continued to rise last week. About 5,000 new patients were admitted each day, double the hospitalization rate in early May.

    Anecdotally, it seems like everyone knows someone who has COVID-19, even if their cases aren’t making it into official data due to at-home tests. And many of those people sick right now already had Omicron BA.1—or even BA.2—earlier this year. Such is the power of BA.4 and BA.5, the subvariants that have taken over the U.S. and many other countries in recent weeks.

    BA.5 in particular seems to have a competitive advantage over all other Omicron subvariants. It’s now causing the majority of new COVID-19 cases in the country, with the most recent CDC estimates placing it at 54% prevalence as of July 2. This recent New York Magazine article does a good job of explaining by BA.5 is so worrying, as does this piece in the Guardian.

    To quote from Melody Schreiber’s Guardian article:

    “Covid-19 is very clearly not over. We’re seeing dramatic increases in the number of cases and hospitalizations in many places throughout the United States,” said Jason Salemi, an associate professor of epidemiology at the University of South Florida’s College of Public Health.

    As BA.5, one of the Omicron sub-variants, begins buffeting the US, “we’re headed in a bad direction”, Salemi said. “We’ve seen it coming for a while … We’ve seen it go pretty unabated.”

    More than one in three Americans live in a county at medium risk from Covid, and one in five are at high risk, according to the US Centers for Disease Control and Prevention (CDC) . That’s the highest proportion of the country facing risks since February, Salemi said.

    Wastewater data from Biobot similarly shows transmission continuing to plateau or increase throughout the country. The Northeast, one region where BA.2 and BA.2.12.1 seemed to peak a couple of weeks ago, is now reporting case increases again. In New York City, for example, all five boroughs are now back in the CDC’s “high risk for hospitalizations” category.

    As this surge continues, essential workers and those who are medically vulnerable continue to be most at risk. Remember this, when you consider masking and other precautions.

  • National numbers, July 18

    National numbers, July 18

    Image
    COVID-19 risk levels by state in May and July. Data from Covid Act Now, posted on Twitter by Eric Topol.

    In the past week (July 10 through 16), the U.S. reported about 184,000 new cases, according to the CDC. This amounts to:

    • An average of 26,300 new cases each day
    • 56 total new cases for every 100,000 Americans
    • 69% more new cases than last week (July 3-9)

    Last week, America also saw:

    • 19,600 new COVID-19 patients admitted to hospitals (6.0 for every 100,000 people)
    • 1,500 new COVID-19 deaths (0.5 for every 100,000 people)
    • 58% of new cases now Delta-caused (as of July 3)
    • An average of 500,000 vaccinations per day (per Bloomberg)

    Cases have been rising for a couple of weeks now, but we’re now seeing the sharpest increase since fall 2020. Between July 9 and July 16, we went from an average of 15,000 new cases a day to an average of 26,000 new cases a day.

    Hospitalizations and deaths are also increasing. We’re now seeing about 26% more new COVID-19 patients in hospitals every day and 36% more new deaths—it’s the first time that deaths have increased since the winter.

    “There is a clear message that is coming through: this is becoming a pandemic of the unvaccinated,” CDC Director Dr. Rochelle Walensky said at a press briefing on Friday. As I’ve continually emphasized in recent issues, states and counties with lower vaccination rates are more vulnerable to the Delta variant.

    Missouri continues to be a hotspot, as does Arkansas, with other states in the Midwest and South also seeing major surges. Florida is of particular concern: one in five U.S. cases in the last week were reported in this state, and Florida has seen a 109% case increase from the first to the second week of July.

    The under-vaccinated hotspots are more likely to see hospitals become overwhelmed with COVID-19 patients (see: this great data visualization by Conor Kelly). But even areas with high vaccination rates are seeing Delta take over. In New York City, Delta now causes 69% of new cases—and case numbers have doubled in the past two weeks. In San Francisco, where a full three-quarters of the eligible population is fully vaccinated, cases and test positivity rates have jumped in July.

    Despite the clear dangers of Delta, millions of Americans still refuse to get vaccinated. As Ed Yong put it in a recent piece on Missouri’s surge: “Vaccines were meant to be the end of the pandemic. If people don’t get them, the actual end will look more like Springfield’s present: a succession of COVID-19 waves that will break unevenly across the country until everyone has either been vaccinated or infected.”

  • National numbers, July 11

    National numbers, July 11

    COVID-19 hospitalizations by age, via the CDC. Adults between ages 18 and 49 now make up over 40% of these patients.

    In the past week (July 3 through 9), the U.S. reported about 104,000 new cases, according to the CDC. This amounts to:

    • An average of 14,900 new cases each day
    • 32 total new cases for every 100,000 Americans
    • 16% more new cases than last week (June 26-July 2)

    Last week, America also saw:

    • 14,300 new COVID-19 patients admitted to hospitals (4.3 for every 100,000 people)
    • 1,100 new COVID-19 deaths (0.3 for every 100,000 people)
    • 52% of new cases now Delta-caused (as of July 3)
    • An average of 500,000 vaccinations per day (per Bloomberg)

    The Delta variant is now officially causing more than half of new cases in the U.S., per the CDC’s Nowcast estimates. This super-transmissible variant has contributed to rising cases in under-vaccinated parts of the country.

    Cases are now up 16% from last week—and there may be more cases that were delayed in reporting due to the July 4 holiday. Missouri continues to be a hotspot, with 127 cases per 100,000 people in the last week; Arkansas is close behind, at 123 cases per 100,000. Both states have under 40% of their populations fully vaccinated.

    Hospitalizations are also rising. We’re up to 2,000 admissions a day; this is far from the country’s peak in January (over 16,000 admissions a day), but is concerning after months of decreases. Like cases, hospitalizations are rising more in the South and West.

    Numerous studies have shown that the vast majority of COVID-19 patients now in U.S. hospitals are unvaccinated. These patients are also younger, on average, than those hospitalized in earlier stages of the pandemic. Adults between ages 18 and 49 now make up over 40% of COVID-19 hospitalizations, according to the CDC; those over 65 only make up 27% of hospitalizations.

    Meanwhile, vaccinations continue to slow. The U.S. administered an average of only 500,000 shots a day last week, per Bloomberg, and surveys indicate that many remaining unvaccinated Americans are unlikely to be convinced. Two changes that might be able to turn the tide, according to the Kaiser Family Foundation: full FDA approval for a vaccine and more vaccination encouragement (or mandates) from employers.

  • National numbers, July 4

    National numbers, July 4

    Cases are rising in unvaccinated areas, such as Las Vegas and parts of Texas. Chart via the July 1 Community Profile Report.

    In the past week (June 26 through July 2), the U.S. reported about 88,000 new cases, according to the CDC. This amounts to:

    • An average of 12,500 new cases each day
    • 27 total new cases for every 100,000 Americans
    • 9.1% more new cases than last week (June 19-25)

    Last week, America also saw:

    • 13,000 new COVID-19 patients admitted to hospitals (4.0 for every 100,000 people)
    • 1,400 new COVID-19 deaths (0.4 for every 100,000 people)
    • 26% of new cases now Delta-caused (as of June 19)
    • An average of 1.1 million vaccinations per day (per Bloomberg)

    This is the first week since April that we’ve seen new COVID-19 case numbers go up in the U.S. It’s nominally a small bump—about 7,300 more cases than last week—but represents a 9% increase, and may be the beginning of a summer surge. (Even if we see a dip in the numbers this week due to the July 4 holiday.)

    The culprit for this case rise is, of course, the Delta variant (B.1.617.2). According to CDC estimates, the variant makes up about 26% of new cases in the country. But, as I have explained in previous issues, the CDC data are old—that 26% estimate is as of June 19, about two weeks ago.

    The Delta variant is doubling every two weeks, so we can assume that the variant now causes at least half of new cases in the U.S. Estimates from other genomic sequencing sources (which are more up-to-date than the CDC, though less comprehensive) indicate that the variant may now be causing up to 60% of new cases.

    This variant poses the most danger to unvaccinated people; many of the current Delta outbreaks are happening in regions with lower vaccination rates. Nevada and Missouri, the two states with the highest new case counts last week, have about 42% and 39% of their populations fully vaccinated, respectively.

    Some metropolitan areas in Missouri, Texas, and other parts of the Midwest have less than one-third of their populations fully vaccinated—and saw more than 200 new cases for every 100,000 people last week. That’s about seven times the national average for new cases. 

    Nationally, hospitalizations also rose very slightly this week, while deaths remained low, at about 200 new COVID-19 deaths each day. The vaccines continue to protect seniors and other more vulnerable people from severe disease. But it is likely that, in the coming weeks, these numbers will start to rise in the areas seeing Delta outbreaks. Many Midwest hospitals are already filling up.

    More on vulnerable, non-vaccinated pockets later in this issue.