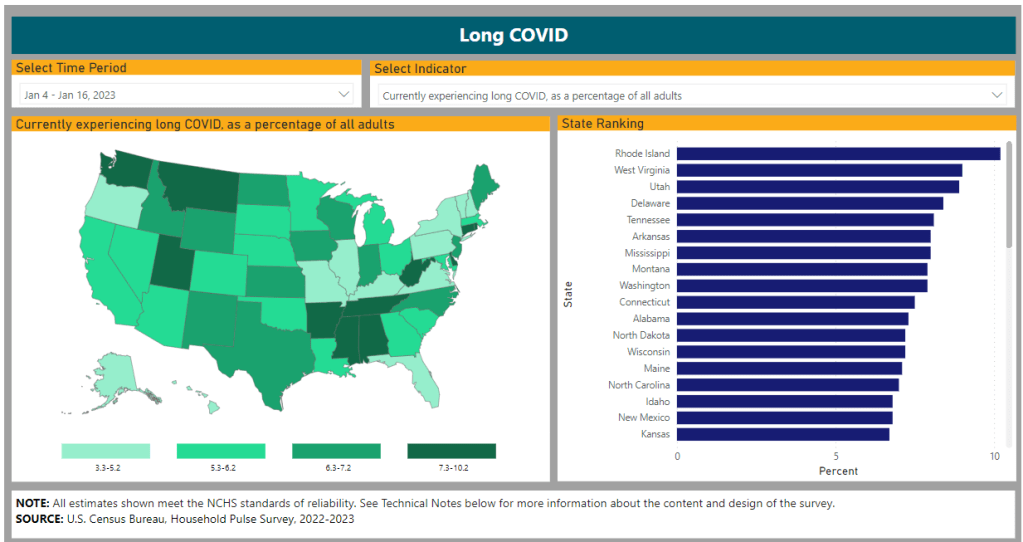
- CDC identifies continued Long COVID risk: A new study from the CDC this week, published in the agency’s Morbidity and Mortality Weekly Report, summarizes data from the CDC and Census Household Pulse Survey examining Long COVID prevalence in the U.S. According to the survey, Long COVID prevalence declined slightly from summer 2022 to early 2023, but has remained consistent this year at about 6% of all U.S. adults. The survey also found that about one in four adults with Long COVID consistently report “significant activity limitations” from the condition, meaning they are less able to work and participate in other aspects of daily life. Treating Long COVID and supporting long-haulers should be priorities for the healthcare system, the study’s authors write.
- Mitochondrial dysfunction in Long COVID: Another new paper, published this week in Science Translational Medicine, demonstrates the role that mitochondria may play in Long COVID. Researchers at the Children’s Hospital of Philadelphia studied tissue samples from autopsies and animals infected with COVID-19, finding that the coronavirus led to malfunctioning mitochondria in several key organ systems. These malfunctions may contribute to Long COVID symptoms such as fatigue and brain fog, and could be a target for future treatments. Elizabeth Cooney at STAT News covered the study in more detail.
- Benefits of vaccination during pregnancy: One more notable new study: researchers at the National Institute of Allergy and Infectious Diseases (or NIAID, part of the NIH) tracked the impacts of COVID-19 vaccination for pregnant people. The study included 240 vaccinated participants who contributed blood samples, between July 2021 through January 2022. Both the parents and their newborns developed antibodies against the coronvirus following infection, the researchers found. While previous papers have demonstrated the value of vaccination for new parents, this study is one of the largest so far to show that protection is conferred to newborns.
- Wastewater surveillance webinar from the People’s CDC: If you’ve been following wastewater data to keep up with COVID-19 trends but have had questions about how this form of surveillance works, you may find it helpful to watch this recorded webinar from health advocacy organization the People’s CDC. In the video, Marc Johnson, a professor at the University of Missouri and director of the state’s wastewater surveillance program, talks through how wastewater is tested for the coronavirus (and variants), how to interpret wastewater data, cryptic lineages, and more. Understanding this novel data source is increasingly important now, as traditional healthcare data on COVID-19 are less reliable.
- New federal heat surveillance dashboard: Finally, in other public health news, the federal government has launched a new dashboard to track heat-related health issues. The dashboard compiles data from Emergency Medical Services reports across the country, representing responses to 911 calls for any health reason related to heat stress. (You can see the list of potential health events in the dashboard’s documentation.) Currently, many southern states are experiencing high levels of heat-related health problems, according to the dashboard. Many of the same states are also experiencing COVID-19 upticks right now—trends that may be related, as more people gather inside during hot weather.
Tag: Household Pulse Survey
-
Sources and updates, August 13
-
COVID-19 dashboards that haven’t shut down yet

The Health Equity Tracker, run by the Morehouse School of Medicine’s Satcher Health Leadership Institute, is one of a few COVID-19 dashboards that is not shutting down at this time. We are in an era of dashboard shutdowns. Government agencies, research groups, and media organizations alike are winding down their COVID-19 reporting efforts. Some of these changes are directly tied to the end of the federal public health emergency in May, while others are more broadly attributed to shifting resources.
In the last couple of weeks alone: the Johns Hopkins COVID-19 dashboard stopped collecting new data, the New York Times switched its COVID-19 tracker to show CDC data instead of compiling original information from states and counties, and the CDC itself announced that its COVID-19 data newsletter will end in May. The White House COVID-19 team will also be disbanded in May, according to reporting from the Washington Post.
I haven’t done a comprehensive review of state and local COVID-19 dashboards, but I’m sure many of those are similarly shutting down, reporting less frequently, and reducing the types of data that they offer to the public. This is a trend I’ve been following since early last year, when state health departments started to declare COVID-19 was now “endemic” and didn’t require special monitoring resources, PCR testing infrastructure, etc. But it’s been accelerating in recent weeks, following the White House announcement about the end of the federal emergency.
When explaining why their COVID-19 reporting efforts are ending, organizations often state that the disease is “no longer a major threat” or say that public interest in tracking COVID-19 has waned. I’m skeptical about both of those claims. First of all, we know that COVID-19 is still killing hundreds of Americans each week, with a majority of those being people who have had multiple vaccine doses. And we know that millions are facing activity limitations from Long COVID. As I wrote last month, the U.S. didn’t have a “mild” winter this year; we’re just getting better at ignoring COVID-19’s continued impacts.
And second of all, I know there’s still an audience for this work—including many of the people who remain most vulnerable to COVID-19. Thank you to everyone who regularly reads this newsletter and blog, sends me questions, shares my work on social media, etc. for constantly validating that the interest is still here.
With all of you great readers in mind, I’ve compiled this list of COVID-19 dashboards that I know haven’t yet shut down. The list is focused on national sources rather than state/local or international ones, in the interest of being most helpful to the majority of readers.
- CDC COVID Data Tracker: The CDC’s COVID-19 dashboard is, of course, the primary source for federal data at this point in the pandemic. It provides weekly updates for most metrics (cases, hospitalizations, deaths, vaccinations, variant estimates, etc.); wastewater surveillance data are updated daily, with individual testing sites reporting on different cadences (usually about twice per week).
Post-PHE update: Still active, but greatly changed. Cases and testing metrics are no longer available (with testing labs and state/local health agencies no longer required to report to the CDC), while other key metrics are updated less frequently or with more of a delay. See this post for more details. - Census Household Pulse Survey: Since early in the pandemic, the U.S. Census’ Household Pulse Survey has provided data on how COVID-19 impacted Americans’ day-to-day lives. This survey’s most recent iteration is scheduled for March through May 2023. The Census collaborates with other federal agencies on its surveys, including the CDC for Long COVID questions.
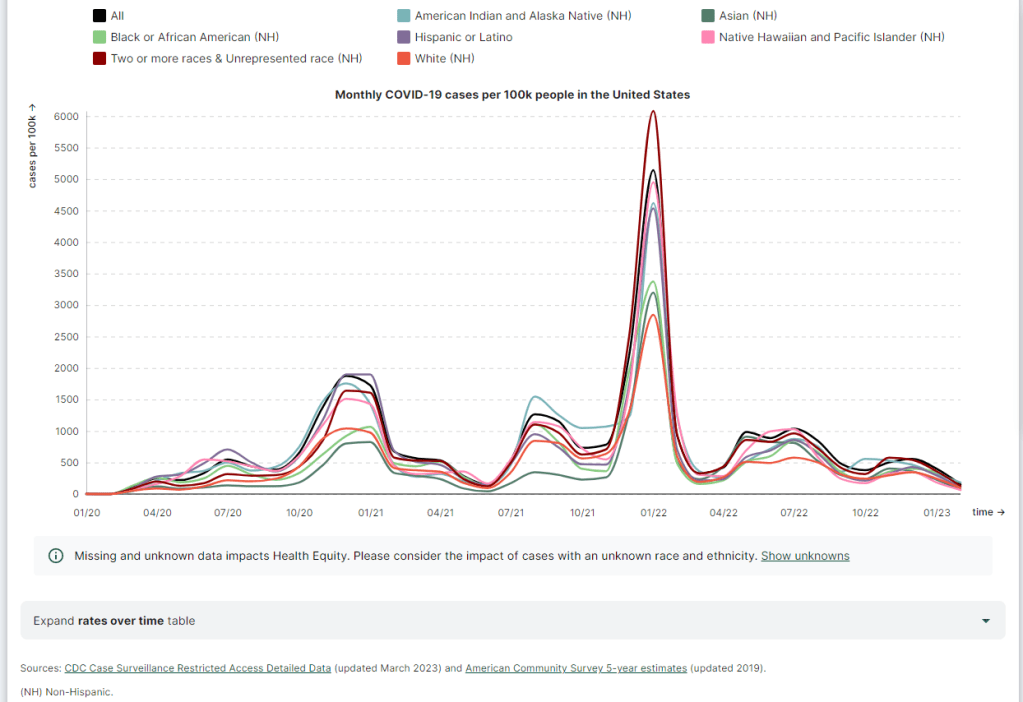
Post-PHE update: The Pulse survey is typically conducted in two-month installments, with several weeks between each installment to adjust questions and process data. Its most recent installment ended in early May, and the next one has yet to be announced; we should know within the next month whether this data source is ending with the PHE or if it will continue. - Morehouse Health Equity Tracker: This project, from the Satcher Health Leadership Institute at the Morehouse School of Medicine, tracks COVID-19 metrics and a variety of other health conditions by race and ethnicity. The COVID-19 data are based on a CDC restricted access dataset; updates will continue “for as long as the CDC gives us data,” software engineer Josh Zarrabi said on Twitter this week.
Post-PHE update: For COVID-19 data, this tracker utilizes a CDC dataset of cases with detailed demographic information, compiled from case reports sent to the CDC by state health agencies. The CDC dataset was last updated in April 2023, and it’s unclear whether it’ll be updated again (but my guess is it’ll end with the PHE). The Morehouse tracker includes plenty of other health metrics, though, so I expect this dashboard will be able to adjust to the CDC change. - APM Research Lab: This research organization, run by American Public Media, has several ongoing COVID-19 trackers. These include COVID-19 deaths by race and ethnicity (national and by state), vaccination rates (national and by state), and Minnesota-specific data, in collaboration with Minnesota Public Radio.
Post-PHE update: APM is continuing to update its tracker; the most recent update to its COVID-19 deaths by race and ethnicity page occurred on May 17. Its staff will likely need to make some changes to their underlying data sources, since the CDC is now reporting COVID-19 deaths differently, but the basic metrics remain available. - Walgreens COVID-19 Index: Walgreens shares data from COVID-19 tests conducted at over 5,000 pharmacy locations nationwide. The tracker includes test positivity (national trends and state-by-state), variant prevalence, and positivity by vaccination status.
Post-PHE update: Still active, with no change due to the PHE’s end. - COVIDcast by CMU Delphi: COVIDcast is a COVID-19 monitoring project by the Delphi Group at Carnegie Mellon University. The dashboard pulls in COVID-19 data from the CDC and other sources, such as Google search trends and antigen test positivity.
Post-PHE update: No longer includes cases and deaths (which were pulled from the CDC), but still updating other metrics, including hospital admissions, symptom searches from Google trends, and COVID-related doctor visits. - Iowa COVID-19 Tracker: Despite its name, the Iowa COVID-19 Tracker displays data from across the country, sourced from the CDC. It’s run by Sara Anne Willette, a data expert based in Ames, Iowa. Willette frequently shares data updates on social media and streams on Twitch when updating her dashboard.
Post-PHE update: Still active, but with some changes due to the new limitations in CDC data. Dashboard manager Sara Anne Willette shares frequent updates on Twitter about what she’s changing and why. - COVID-19 dashboard by Jason Salemi: This dashboard by University of South Florida epidemiologist Jason Salemi is another page displaying CDC data in somewhat-more-user-friendly visualizations. The dashboard is focused on Florida, but shares national state- and county-level data.
Post-PHE update: Salemi shared on Twitter last week that he is currently assessing whether to keep the dashboard running or decomission the site. - Biobot Analytics: Biobot Analytics is the leading wastewater surveillance company in the U.S., tracking COVID-19 at hundreds of sewershed sites through its partnership with the CDC National Wastewater Surveillance System and independent Biobot Network. The dashboard has helpful national- and regional-level charts along with county-level data for sites in Biobot’s network.
Post-PHE update: Still active, no changes due to the PHE’s end. In fact, Biobot continues to add more wastewater testing sites to its network. - WastewaterSCAN: WastewaterSCAN is another leading wastewater project, led by professors at Stanford and Emory Universities. The project started with sites in California, but has since expanded nationwide; it’s tracking several other common viruses in addition to COVID-19.
Post-PHE update: Still active, similarly to Biobot’s dashboard. - For more wastewater data: Check out the COVID-19 Data Dispatch resource page with annotations on state and local dashboards.
- KFF COVID-19 Vaccine Monitor: Since late 2020, the Kaiser Family Foundation has monitored American attitudes around COVID-19 vaccines and other pandemic issues. Updates were initially released monthly, but have become less frequent in the last year (the latest update was published on February 7, 2023).
Post-PHE update: This KFF project appears to be ongoing, but at a lower frequency of updates; the most recent update is still February 2023. A newer KFF dashboard (tracking Medicaid enrollment and unwinding) is also receiving ongoing updates. - Axios-Ipsos COVID-19 polls: Axios has partnered with the polling firm Ipsos on regular polls tracking COVID-19 views and behaviors. The polling data are available in PDF reports and in spreadsheets from Roper. In 2023, Axios and Ipsos shifted their focus from COVID-19 to broader questions about public health, with a new series of quarterly polls.
Post-PHE update: These two organizations will continue their new series of quarterly polls about public health, launched in early 2023. The most recent installment was posted this past week and includes questions about the PHE’s end, gun violence, opioids, and more.
Have I missed any major data sources? Send me an email or comment below to let me know, and I’ll highlight it in a future issue.
Editor’s note, April 2, 2023: This post has been updated with two additional dashboards (APM Research Lab and Walgreens), and additional information on the CDC’s wastewater surveillance dashboard.
Editor’s note, May 21, 2023: This post has been updated with notes about changes impacting these dashboards due to the end of the federal public health emergency (PHE).
More federal data
- CDC COVID Data Tracker: The CDC’s COVID-19 dashboard is, of course, the primary source for federal data at this point in the pandemic. It provides weekly updates for most metrics (cases, hospitalizations, deaths, vaccinations, variant estimates, etc.); wastewater surveillance data are updated daily, with individual testing sites reporting on different cadences (usually about twice per week).
-

How researchers track Long COVID’s impacts
The Census and CDC’s Household Pulse Survey provides one major source of data on Long COVID prevalence. I got an interesting question from a reader last weekend, asking if excess deaths might be one way to identify the impact of Long COVID. It’s an interesting idea: could the numbers of deaths from medical causes above what researchers expect in a given timeframe indicate some premature deaths tied to Long COVID?
Based on my previous work with excess deaths (see MuckRock’s Uncounted project), I think this could be possible, though it’d likely be very hard to identify direct relationships between Long COVID and specific deaths. As far as I know, no researchers are working on this question; if you know of anyone who is, please reach out.
Still, the reader’s question got me thinking about how, exactly, we track the impacts of Long COVID. Doctors, researchers, and long-haulers themselves have learned a lot about the condition over the last three years. We still don’t have clear estimates of exactly how many people in the U.S. are dealing with this chronic disease, but we’ve come much closer to understanding its impacts than we were when patients first began advocating for themselves in 2020.
Tracking Long COVID is challenging because of uneven access to COVID-19 tests and to medical care, which means long-haulers with certain types of privilege are more likely to get an accurate diagnosis. A lack of knowledge about Long COVID, both among medical professionals and among the overall population of people who might get it, also contributes to this issue. (For more details, see this post from early December.)
Still, some strategies have emerged for identifying people with Long COVID and tracking how the condition is impacting them. Here are a few.
Following people who were hospitalized for COVID-19:
In this strategy, researchers identify people who had COVID-19 and track how the virus impacts them over time. It’s often easiest for researchers to track people who were hospitalized, since hospitals keep detailed medical records of their patients, though this tactic leaves out long-haulers who initially had mild cases.
Sometimes, researchers doing this type of follow-up study will directly survey COVID-19 patients, which can lead to more comprehensive data than using health records alone. One recent study in this category found that, among a group of 800 adults hospitalized for COVID-19, about half were still experiencing some financial issues and limitations in their ability to do day-to-day activities six months later. The study’s authors noted that financial issues were “reported more frequently” among patients who identified with demographic minorities.
Following COVID-positive patients through electronic health records:
In other studies, researchers use electronic health records to identify how people who had COVID-19 fare months later. Two recent studies associated with the National Institutes of Health’s RECOVER initiative fall into this category. One paper utilized records from New York City health centers, and found that Black and Hispanic adults were more likely to have potentially Long COVID-related health issues following a COVID-19 case. The other paper, which used records from 34 medical centers across the U.S., found that white, female, non-Hispanic patients living in areas with greater healthcare access were more likely to receive an actual Long COVID diagnosis.
Angela Vázquez, president of the Long COVID group Body Politic, summarized the two new studies succinctly on Twitter, writing: “Black and Hispanic Americans appear to experience more symptoms and health problems related to #LongCovid than white people, but are not as likely to be diagnosed with the condition.” Vázquez also pointed out that the studies may have missed neurological symptoms among Black and Hispanic patients, due to less access to care for these groups.
Broad surveys of potential patients:
Electronic health records are far from perfect sources of Long COVID data, as they often present only sets of information that doctors are already compiling—and they are often biased towards the people who are able to access medical care for COVID-19 (or Long COVID) in the first place. As a result, some researchers track Long COVID through broader surveys, seeking to identify everyone who might have some long-term symptoms following a COVID-19 case, even if those people might not be calling their condition “Long COVID.”
The Census and CDC’s Household Pulse Survey questions on Long COVID are one notable example of this strategy. Census researchers ask a random sample of Americans whether they’ve had “any symptoms lasting 3 months or longer” following a COVID-19 case, then follow up with questions about whether those symptoms are current and whether they impact the respondent’s ability to carry out day-to-day activities. The resulting data provide a broader view of Long COVID in the U.S., including people who may not have sought medical care for their symptoms.
Biological studies of specific organs impacted by COVID-19:
In order to better understand how a case of COVID-19 may lead to long-term, debilitating symptoms, some researchers focus on studying exactly what happens to different parts of the body after a coronavirus infection. This research sometimes focuses on testing for the continued presence of virus after a patient’s acute COVID-19 case is over or tracking changes to the immune system, as scientists test different theories into how Long COVID occurs.
One major area of research has been the brain. Freelance journalist Stephani Sutherland recently published a major feature in Scientific American exploring how Long COVID impacts the brain and nervous system, summarizing research into the biological causes of common symptoms like fatigue and brain fog. Physician E. Wesley Ely, who cares for Long COVID patients, wrote an essay on the same topic that appeared in STAT News this week; Ely discussed what he’s learned from autopsy studies examining the brains of people who had COVID-19.
Identifying trends in the labor market:
Finally, researchers often seek to track the impacts of Long COVID indirectly, by looking at statistics on people who have left the labor market during recent years. It’s no secret that a lot of people have left their jobs during the pandemic; Long COVID experts argue that the chronic disease may be one major driver of the labor shortage. One often-cited Brookings Institution analysis suggested two to four million people may be out of work due to Long COVID.
This strategy for studying Long COVID may be the most difficult, as it’s hard to actually tie job loss numbers to the condition without more specific data. Most research surveys or electronic health records databases don’t ask people about their work situations; the recent study cited above is a notable outlier. Similarly, most unemployment claims and short-term disability datasets don’t ask people if Long COVID is contributing to their need for assistance.
Still, I hope to see more studies in the future that examine Long COVID’s impact on work and other activities. Related: the U.S. Department of Labor recently published a report about the need for more assistance geared toward workers with Long COVID.
More Long COVID data
-
Sources and updates, October 9
- Household Pulse Survey updates, expands Long COVID data: This week, the CDC and Census released an update of their Household Pulse Survey results on how Long COVID is impacting Americans. In addition to more recent data on Long COVID prevalence, the update includes new information on how adults with the condition find it limiting their day-to-day activities. The data shows that, out of all adults currently experiencing Long COVID symptoms, over 80% have some activity limitations and 25% have “significant” activity limitations. (For more context on this dataset, see my post from June.)
- NIH shares update on RECOVER study: Speaking of Long COVID, the National Institutes of Health’s Directors Blog shared a post this week with updates on its flagship RECOVER study to learn more about the condition. Major updates include: RECOVER’s current recruitment goal is 17,000 adults and 18,000 children; the NIH recently awarded more than 40 grants to research projects examining the condition’s underlying biology; and RECOVER is utilizing electronic health records to track patients over time. While this is all valuable progress, patient advocates have expressed concerns about limited involvement by post-viral chronic illness experts in RECOVER so far.
- Paxlovid is going under-utilized, study finds: A new report from the health records company Epic Research provides evidence that Paxlovid reduces severe COVID-19 outcomes: patients over age 50 who received the antiviral drug were about three times less likely to be hospitalized, compared with those who didn’t. The study also found, however, that eligible Americans aren’t taking advantage of this treatment. Out of about 570,000 people who “could have received Paxlovid” between March and August 2022, only 146,000 (about one in four) actually got prescriptions. Paxlovid needs to be better advertised and easier to access.
- New COVID-19 pill added to Medicines Patent Pool: And a new COVID-19 treatment option is becoming available internationally. Shionogi, a Japanese pharmaceutical company, recently signed an agreement with the Medicines Patent Pool, an international public health organization that facilitates increased drug access in low- and middle-income countries. The agreement allows other drug companies to make Shoinogi’s antiviral COVID-19 pill, called ensitrelvir fumaric acid, which has seen some promising results in clinical trials so far. Paxlovid and Molnupiravir (Merck’s antiviral pill) are already licensed by the pool.
- Patient access to electronic health records expands: This past Thursday, new federal rules took effect requiring healthcare companies to “give patients unfettered access to their full health records in digital format,” as STAT News reporter Casey Ross put it. This is a major milestone for the democratization of health data, as patient records have historically been locked in a labyrinth of private databases—though more public education is needed to help people actually take advantage of the new rules. Personally, I hope this is a first step towards more record-sharing between health institutions, which could be a key step for more comprehensive analysis in the future.
-

12 statistics showing the pandemic isn’t over

Long COVID and ME/CFS patients protest in front of the White House, telling Biden that the pandemic is not over and demanding action on their conditions. Image courtesy of ME Action. Last Sunday, 60 Minutes aired an interview with President Joe Biden in which he declared the pandemic is “over.”
“The pandemic is over,” Biden said, while walking through the Detroit Auto Show with 60 Minutes correspondent Scott Pelley. “We still have a problem with COVID. We’re still doing a lot of work on it. But the pandemic is over. If you notice, nobody’s wearing masks, everybody seems to be in pretty good shape.”
Most of the debate and dissection of this interview has focused on Biden’s statement that the “pandemic is over.” Is it, actually? (Epidemiologists say no.) Does he have the authority to declare it over? (No, that’s a job for the WHO.) Was his statement just reflecting what most Americans are already thinking? (Depends on who you call “most Americans.”)
See, I think the key part of Biden’s quote here actually comes at the end: “everybody seems to be in pretty good shape.” Seems to be is doing a lot of work here. In the interview, Biden is strolling through the auto show, through groups of unmasked people looking at car exhibits.
He is not actually talking to these bystanders, asking them whether they’ve lost loved ones to COVID-19, lost work during the pandemic, or faced any lingering symptoms after catching the virus themselves. Biden also isn’t considering the people who were excluded from this auto show: the Americans who were left disabled with Long COVID, and those still taking safety precautions due to other health conditions.
Images of the auto show, like those of packed indoor restaurants or maskless stadiums, seem to suggest that, yeah, Americans no longer care about COVID-19. But there are plenty of other images that don’t make it into high-profile media settings like Biden’s interview.
Today, I invite you to consider a few of the images that Biden isn’t seeing. Here are 12 statistics showing how the COVID-19 pandemic continues to have a massive impact on Americans:
- At least 400 Americans are dying with COVID-19 every day, about 47,000 deaths total between June and September 2022. Daily death data tend to be underestimates, because it can take weeks to process death certificates (and numbers are often retroactively edited up). But we can still see that hundreds of people are dying each day. As Sarah Zhang points out in The Atlantic, this is several times the threshold experts set in early 2021 for calling the pandemic at an end.
- About 25,000 people are currently hospitalized with COVID-19 cases. Yes, many of the people included in this statistic probably entered the hospital for another reason, then tested positive as part of routine screening. But incidental coronavirus infections still put pressure on the hospitals caring for these patients, and can intersect with a wide variety of other health conditions, potentially causing long-term issues for patients.
- About 7.6% of adults are currently experiencing some form of Long COVID, as of early August. This estimate, which I pulled from the Census and CDC’s Household Pulse Survey, rises for certain demographics: almost 10% of women, 11% of transgender adults, 11% of adults with less than a high school diploma, and 15% of adults with a disability are currently experiencing Long COVID.
- Hundreds of Long COVID and ME/CFS patients protested at the White House and online on Monday. Biden’s statement coincidentally landed the night before a planned protest, in which patient-advocates called for the president to declare a national emergency around Long COVID and ME/CFS. The protest was covered in the New York Times, MedPage Today, the BMJ, and other outlets.
- 19 patients, patient-advocates, and experts testified at a New York City Council hearing about Long COVID and gender on Thursday. Long COVID patients and those with related conditions (like ME/CFS and HIV) talked about dismissals from doctors and inability to return to their pre-COVID lives. They called for more comprehensive medical care and other forms of financial and social support for patients. I covered the hearing for Gothamist/WNYC.
- About 2.5 million adults were recently out of work due to a COVID-19 case, either because they were sick themselves or were caring for a sick person. Another 1.6 million adults were out of work due to concern about getting or spreading COVID-19. These statistics come from the most recent iteration of the Household Pulse Survey, conducted from July 27 to August 8, 2022.
- About 2.2 million adults were recently laid off or furloughed due to the COVID-19 pandemic. Another one million had their employers go out of business due to the pandemic, and 900,000 had their employers close temporarily due to COVID-19. These data are from the same Household Pulse Survey.
- Over 50 million adults experienced symptoms of anxiety for at least half the days in the last two weeks, at the time of the most recent Household Pulse Survey. Almost 40 million adults experienced symptoms of depression for at least half the days in the same two-week period.
- Over 80% of Americans still support the federal government providing free COVID-19 vaccines, treatments, and tests to anyone who needs them, according to an Axios-Ipsos poll conducted in early September. A past iteration of that poll, from March 2022, found that 74% of Americans reported they were “likely to wear a mask outside the home if COVID-19 cases surge again in their area.”
- About 3% of Americans, or around 12 million people, are immunocompromised and still have reason to take intense COVID-19 precautions. Immunocompromised people have been eligible for extra vaccine doses, but are still more vulnerable to both severe COVID-19 symptoms and Long COVID.
- Over one million seniors live in nursing homes, and almost one million more live in assisted living and other forms of long-term care facilities. Seniors in long-term care have represented a hugely disproportionate share of deaths from COVID-19, and the CDC just made its mask recommendations for these facilities much more lenient—putting many vulnerable adults at risk.
- 2.5 billion people worldwide still haven’t been vaccinated, according to estimates from Our World in Data. Bloomberg’s vaccine tracker estimates that, at the current pace of first doses administered, it will take another 10 months for just 75% of the global population to have received at least one COVID-19 shot. As long as COVID-19 continues to spread anywhere in the world, new variants can be a threat everywhere.
More on Long COVID
