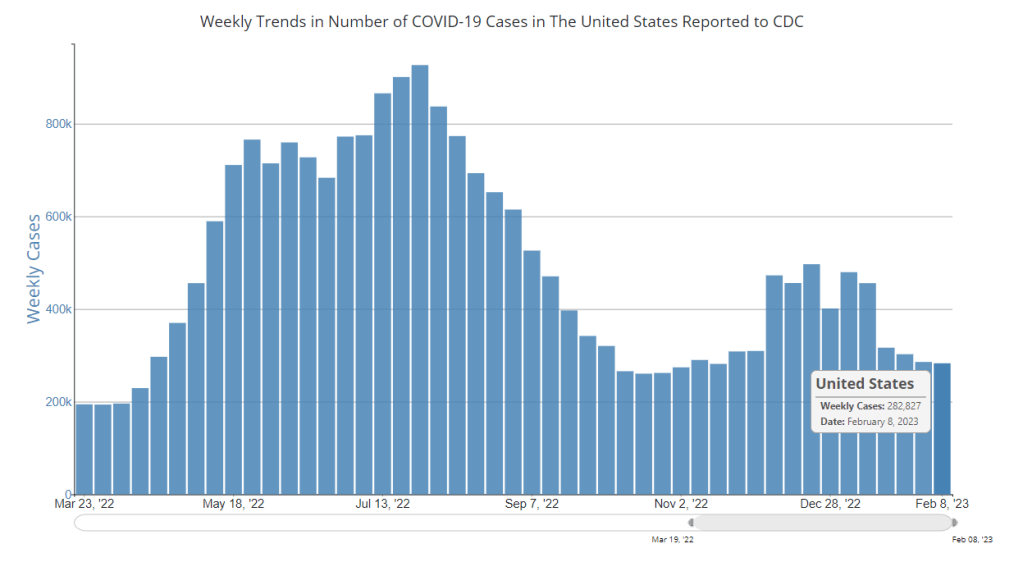
In the past week (February 16 through 22), the U.S. officially reported about 240,000 new COVID-19 cases, according to the CDC. This amounts to:
- An average of 34,000 new cases each day
- 72 total new cases for every 100,000 Americans
- 9% fewer new cases than last week (February 9-15)
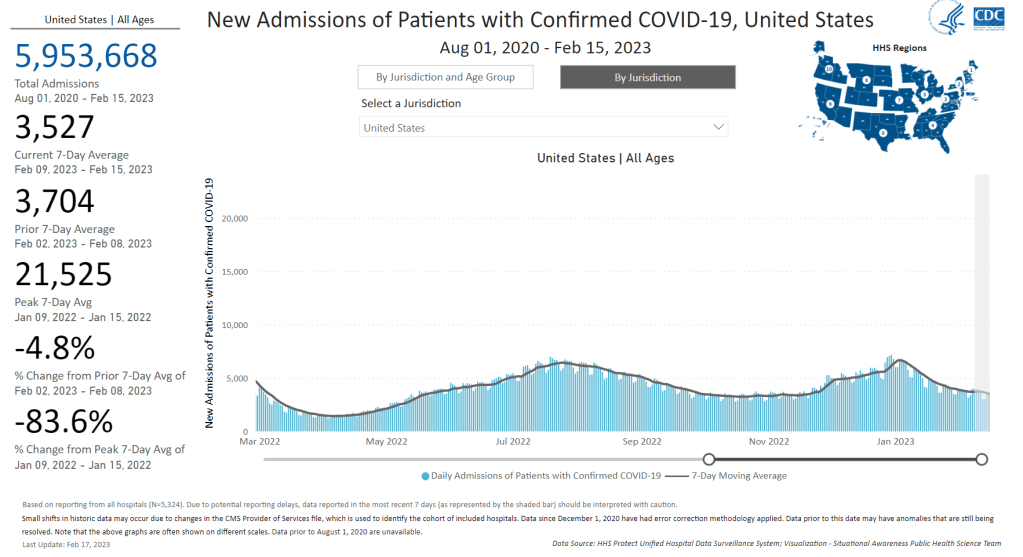
In the past week, the U.S. also reported about 25,000 new COVID-19 patients admitted to hospitals. This amounts to:
- An average of 3,500 new admissions each day
- 7.5 total admissions for every 100,000 Americans
- 5% fewer new admissions than last week
Additionally, the U.S. reported:
- 2,400 new COVID-19 deaths (350 per day)
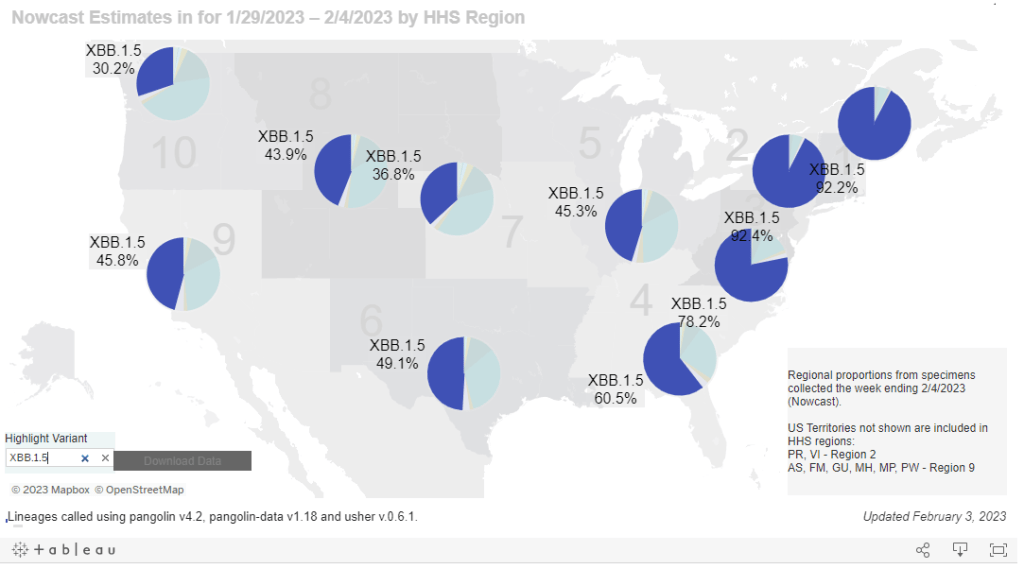
- 85% of new cases are caused by Omicron XBB.1.5; 12% by BQ.1 and BQ.1.1; 1% by CH.1.1 (as of February 25)
- An average of 60,000 vaccinations per day
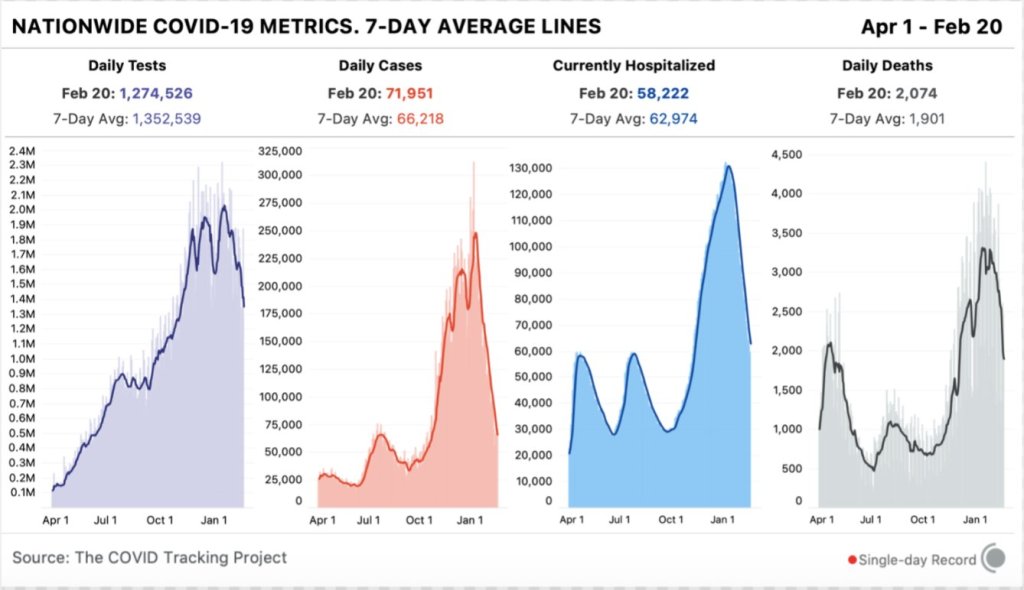
The national COVID-19 plateau continues. As I’ve been saying for a few weeks now, COVID-19 spread has dropped significantly from its high during the winter holidays, but it has not fallen to the low levels we’ve previously seen this time of year due to a combination of lax precautions and the latest Omicron variant, XBB.1.5.
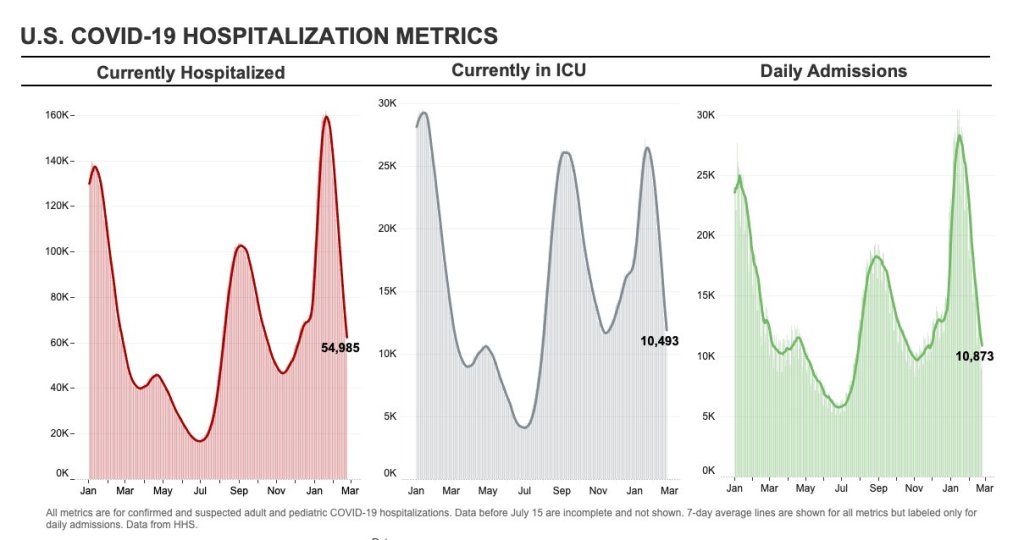
Case and hospitalization data from the CDC, along with wastewater surveillance data, all show COVID-19 spread declining—but very slowly. Cases declined by 9% this week compared to the week prior, while new hospital admissions declined by 5%. Biobot’s wastewater surveillance dashboard shows slight declines or plateaus in all four major regions of the country.
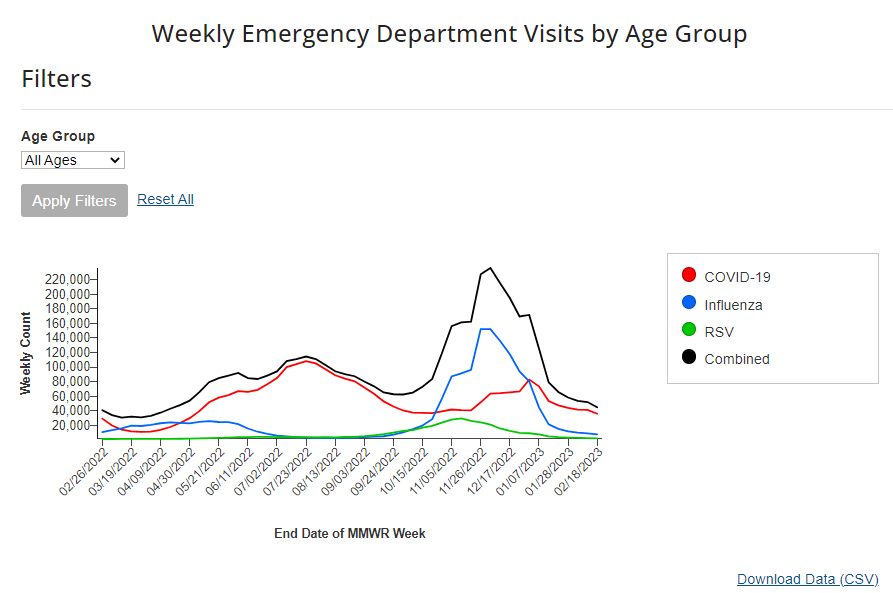
Respiratory virus season is clearly waning in the U.S., according to hospital emergency room visit data from the CDC’s National Syndromic Surveillance Program. ER visits for the flu and RSV have pretty much returned to baseline after their winter peaks. But COVID-19 ER visits have plateaued at a higher level, close to the visit numbers reported in September and October—another sign of the elevated “low tide” we’ve now been dealing with since spring 2022.
On the variant front: Omicron XBB.1.5 continues to dominate in the U.S. It caused an estimated 85% of new cases nationwide in the week ending February 25, according to the CDC, and is the main variant circulating in every region. After several months of “variant soup” with a number of Omicron subvariants competing, XBB.1.5 has emerged as the clear victor; no other single lineage is causing more than 10% of new cases in the country, per the CDC’s estimates.
I continue to write about COVID-19 case numbers from the CDC here, mostly because A) the directional patterns (i.e. upticks and downturns) of these data are still a decent representation of actual directional patterns in infections, and B) the CDC’s case numbers are more nationally representative (when it comes to geography) than data from the National Wastewater Surveillance System.
But I have to stress that these case numbers are increasingly undercounting actual infections. The last decent estimates I’ve seen comparing cases to infections, dated from last fall, suggested that case numbers are undercounted by a factor of 10 to 20. These days, I expect we’re likely closer to a factor of 20, if not higher. As evidence, test positivity for the entire U.S. has been at 10% for a couple of weeks now.
Other evidence for this continued undercounting comes from wastewater data. From resources like the Biobot dashboard, which compares wastewater surveillance trends to case trends, it’s abundantly clear that these two metrics used to align closely—but now coronavirus levels in wastewater are consistently much higher. In New York City, for example, wastewater data show that the city experienced one of its greatest COVID-19 surges this winter.
Speaking of unreliable numbers: the team behind the CDC’s COVID Data Tracker Weekly Review has begun to update its readers on how the end of the federal public health emergency will impact COVID-19 data. The first update, published on Friday, explains that some data, including hospitalization and vaccination numbers, “may be reported less frequently” or with new gaps. I anticipate we’ll get more details about this in the coming weeks, as the CDC negotiates new data-sharing requirements with other health agencies.
The CDC’s data tracking newsletter is also shifting from a weekly newsletter to biweekly, starting March 3. It continues to boggle my mind how I, a single freelance journalist writing this publication in my spare time, am able to keep up more regular data updates than a massive federal agency.