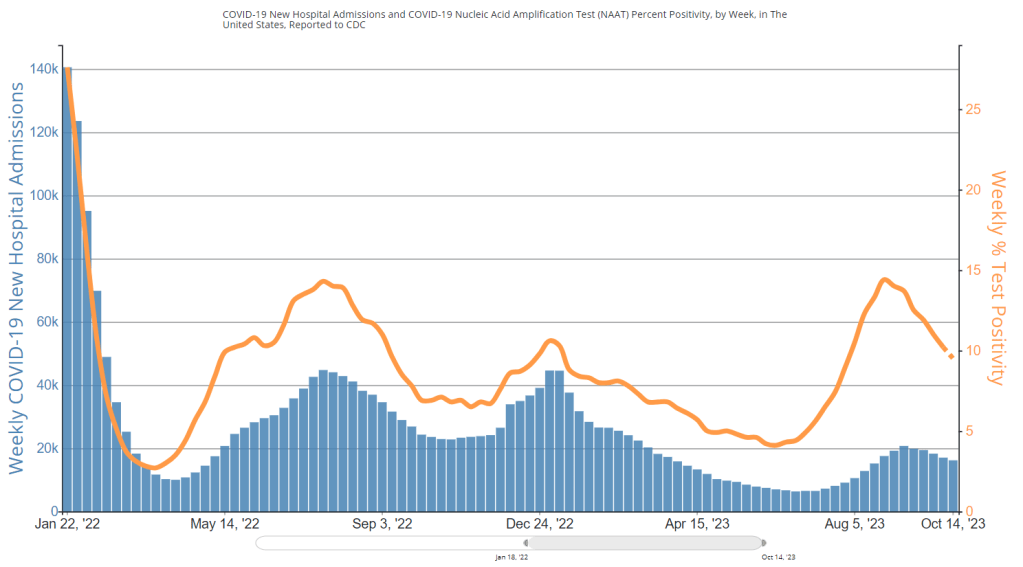

During the most recent week of data available (October 22-28), the U.S. reported about 15,700 new COVID-19 patients admitted to hospitals, according to the CDC. This amounts to:
- An average of 2,200 new admissions each day
- 4.8 total admissions for every 100,000 Americans
- 0.1% more new admissions than the prior week (October 15-21)
Additionally, the U.S. reported:
- 9% of tests in the CDC’s surveillance network came back positive
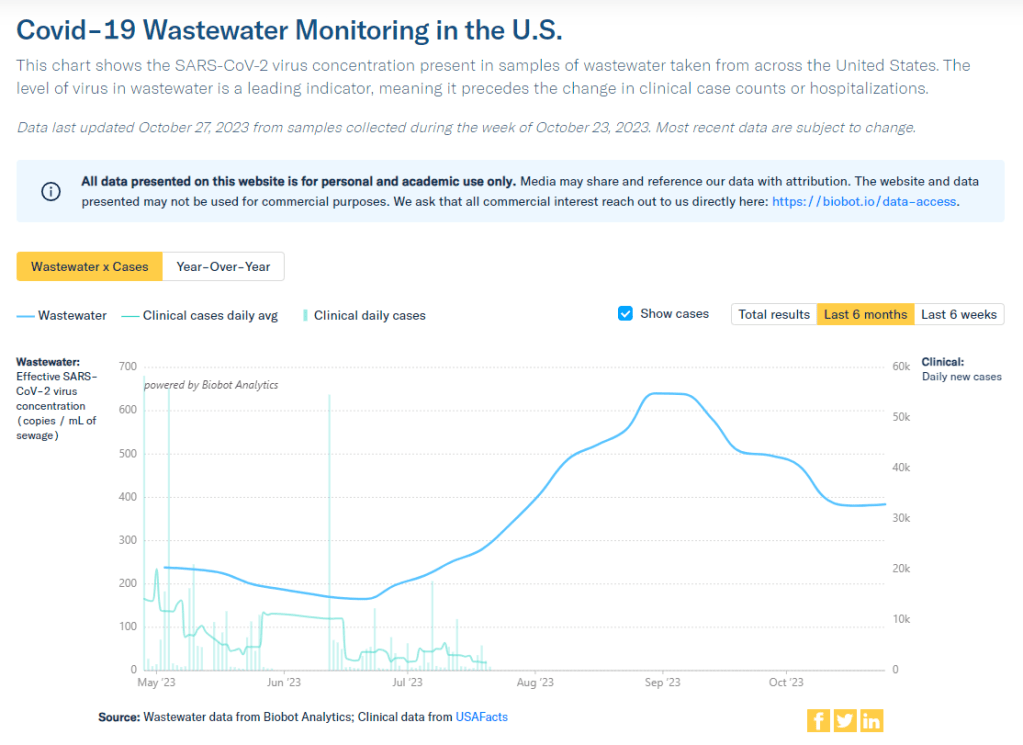
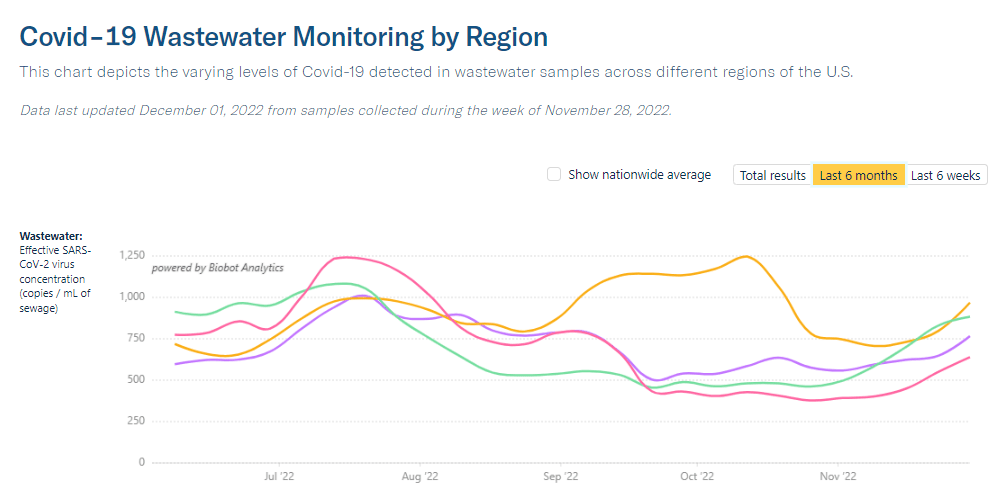
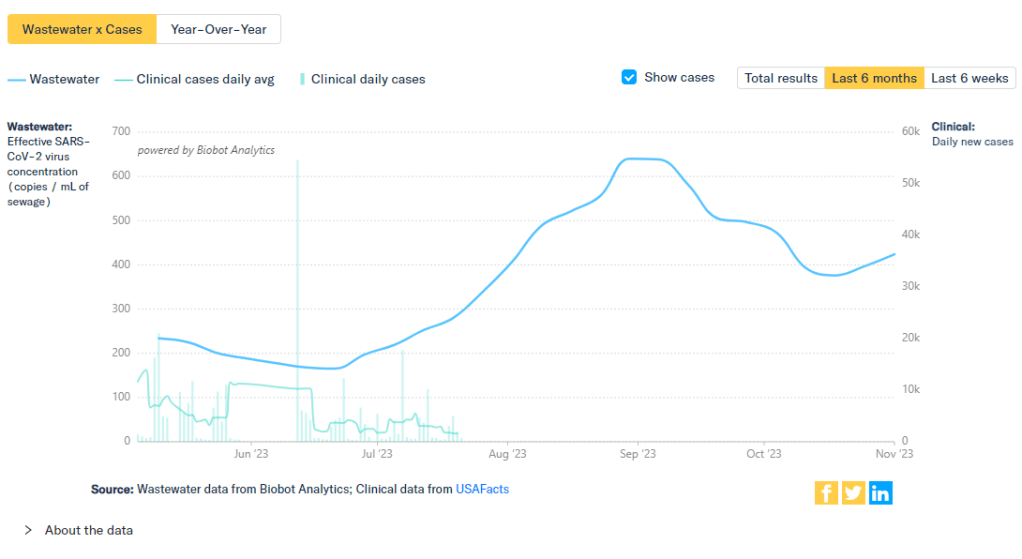
- A 7% higher concentration of SARS-CoV-2 in wastewater than the prior week (as of November 1, per Biobot’s dashboard)
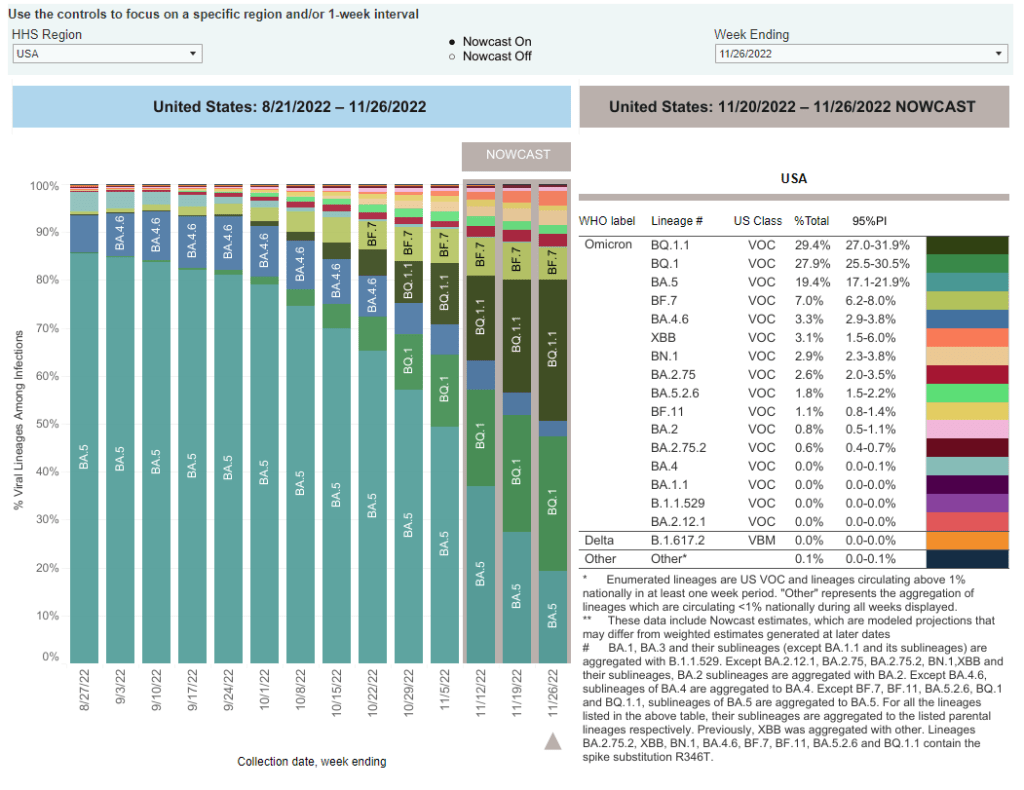
- 25% of new cases are caused by Omicron HV.1, 22% by EG.5, 17% by XBB.1.6, 12% by FL.1.5.1 (as of October 28)
Most of the numbers above are exactly copied from last week’s National Numbers post, as the CDC didn’t update its COVID-19 dashboard this week. Honestly, I have no idea why a single-day holiday (i.e. Veteran’s Day yesterday) might lead a national health agency to postpone its data updates for an entire week, but I’m sure this won’t be the last time it happens.
The new data we do have this week, mainly from wastewater dashboards, suggest that COVID-19 spread is increasing slightly along with other respiratory viruses. Data from Biobot and WastewaterSCAN show upticks in the last two weeks, following the declining spread from September through the end of October.
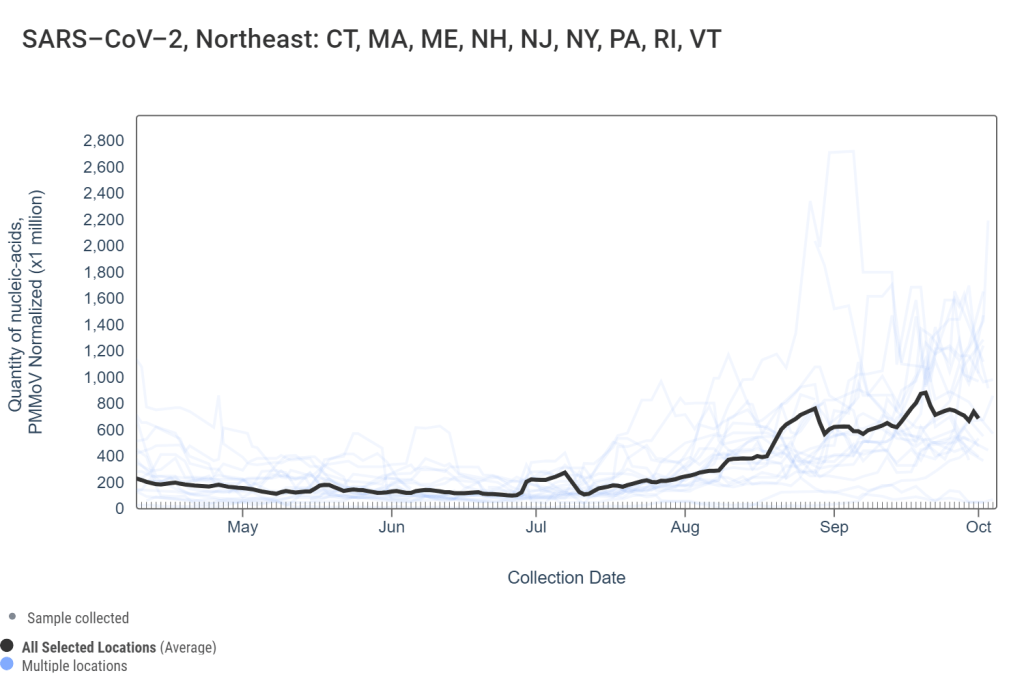
Biobot’s dashboard shows that the concentration of coronavirus in U.S. sewersheds has gone up about 13% on average nationally, from October 18 through November 1. Coronavirus levels are currently highest in the Midwest, with the West Coast and South showing signs of increasing spread while the Northeast is in a plateau.
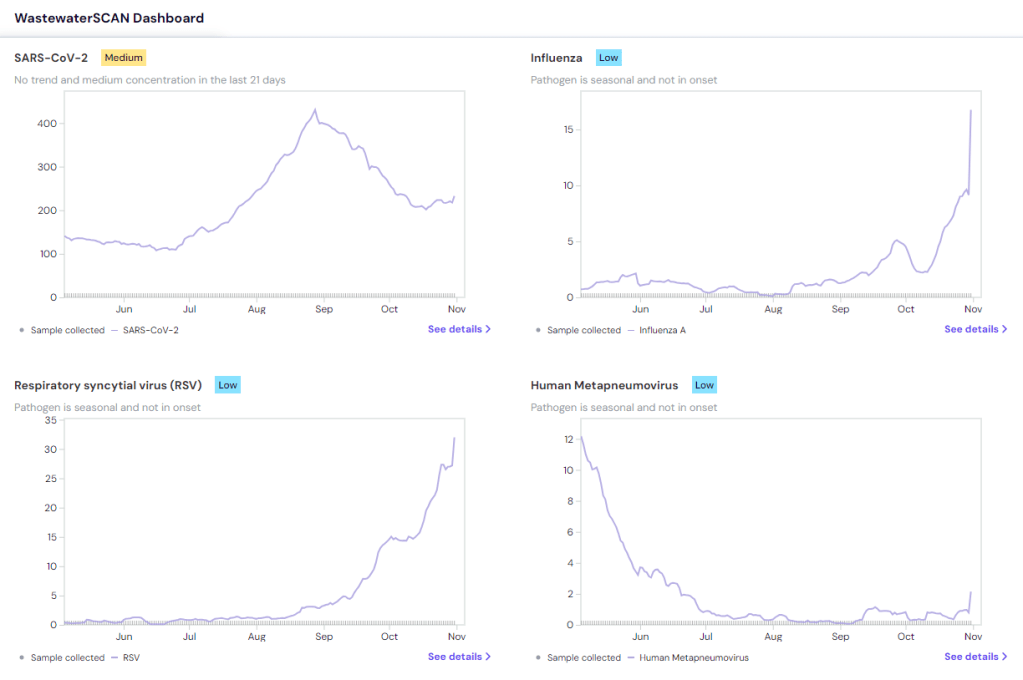
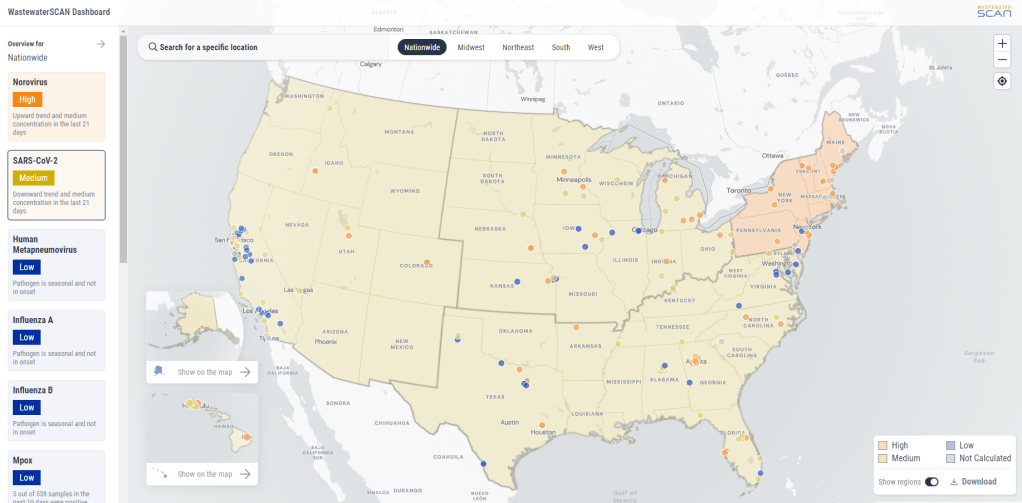
WastewaterSCAN’s dashboard presents a similar picture: the Midwest currently has high coronavirus levels, according to WWSCAN’s thresholds, while the other regions have moderate levels. This dashboard shows rising COVID-19 transmission in the Midwest and South as well, with cities like Warren, Michigan, Lincoln, Nebraska, and Arkon, Ohio reporting significant increases in recent weeks.
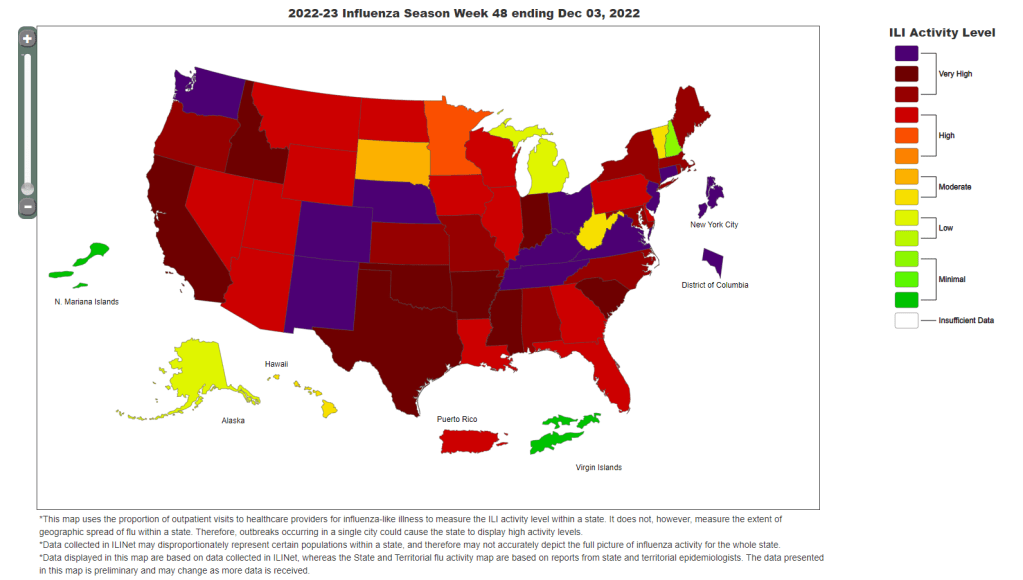
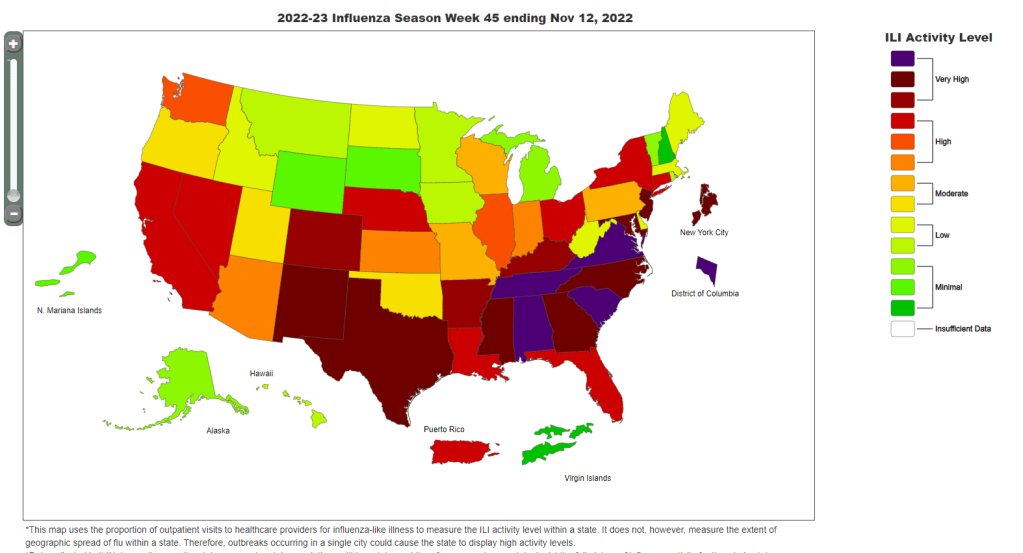
COVID-19 isn’t the only virus spreading a lot right now, according to WWSCAN and the CDC. The CDC said in its most recent flu surveillance report that this seasonal virus is increasing throughout the country, though it hasn’t yet reached typical flu season levels. This report was published over a week ago, on November 3, but it seems likely that the trend has continued this week.
Both wastewater surveillance and the CDC’s influenza-like activity surveillance, which tracks doctors’ visits for respiratory symptoms, suggest that the South is seeing increased spread of several viruses: COVID-19, flu, RSV, norovirus. Norovirus and RSV in particular are at high levels nationwide, according to WWSCAN.
Similar safety measures—masks, testing, improved ventilation, getting vaccinated—protect against many common diseases. Recent data from the CDC show that many people are, at least, getting vaccinated, though vaccination rates are currently much higher for flu than COVID-19 among both adults and children. (Public health agencies clearly have some work to do there.)