Tag: EG.5

  • National numbers, August 20

    National numbers, August 20

    While the rise in hospitalizations has been modest, test positivity is on a similar level to the last couple of surges, per the CDC. Data as of August 18.

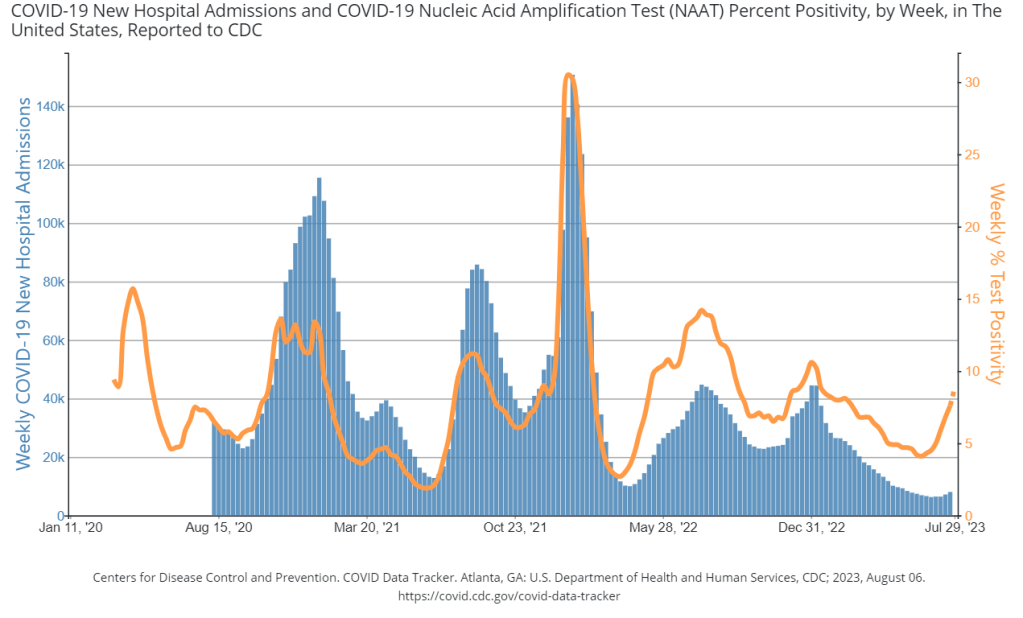
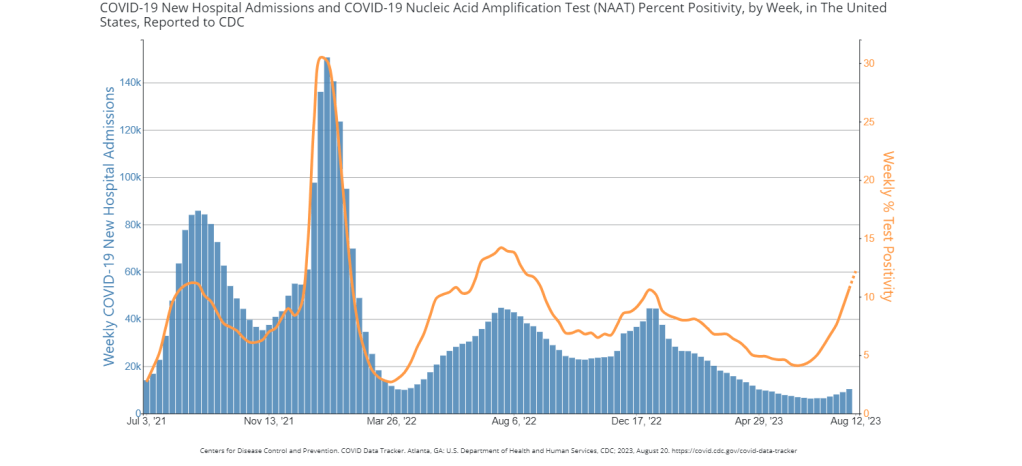
    During the most recent week of data available (July 30 through August 5), the U.S. reported about 10,300 new COVID-19 patients admitted to hospitals, according to the CDC. This amounts to:

    • An average of 1,500 new admissions each day
    • 3.1 total admissions for every 100,000 Americans
    • 14% more new admissions than the prior week (July 23-29)

    Additionally, the U.S. reported:

    • 12.2% of tests in the CDC’s surveillance network came back positive
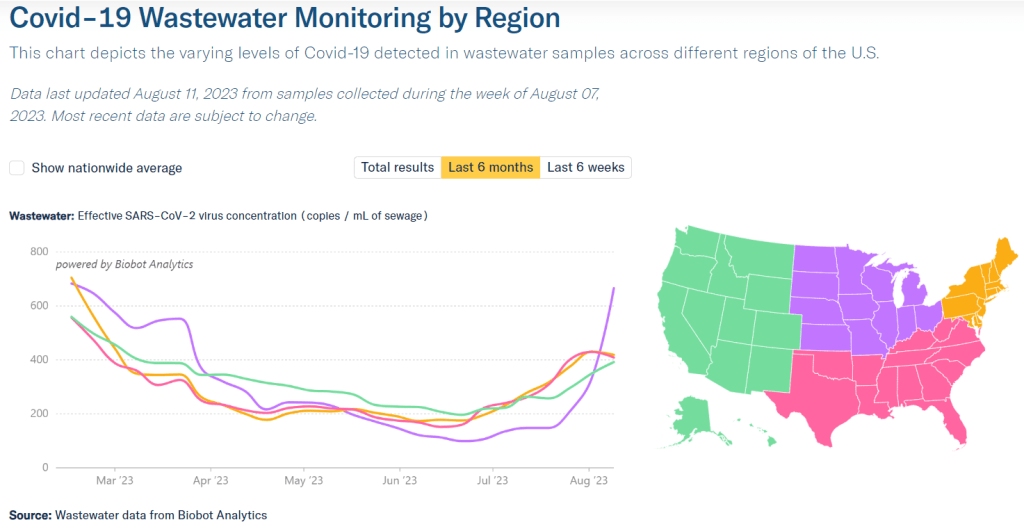
    • A 10% higher concentration of SARS-CoV-2 in wastewater than last week (as of August 16, per Biobot’s dashboard)
    • 25% of new cases are caused by Omicron XBB.1.6; 21% by EG.5; 11% by XBB.2.3; 13% by FL.1.5.1 (as of August 19)

    The summer COVID-19 surge continues. While wastewater surveillance data suggest that transmission trends may be turning around in some places, the virus is largely still increasing across the U.S. New variants are on the horizon, too.

    Nationally, coronavirus levels in wastewater are the highest they’ve been since last winter’s holiday surge, according to data from Biobot Analytics. Viral concentrations have tripled since mid-June, and continue to follow a similar pattern to the Delta surge that we experienced at about the same time in summer 2021.

    Biobot’s regional data suggest that the Midwest—which reported a serious spike last week—may have turned a corner in this surge, with viral levels going into a plateau. This pattern is based on just one week of data, though, so we’ll have to see what next week’s numbers show.

    Wastewater data from the CDC and WastewaterSCAN similarly show continued increases in COVID-19 spread. Some counties in Southern states, such as Florida, Georgia, and Alabama, are reporting particularly large upticks. Hawaii may be a state to watch, too, as residents face health access challenges following the recent wildfires.

    Test positivity also continues to increase, with the CDC reporting that about 12% of COVID-19 tests reported to its respiratory network returned positive results in the week ending August 16. Hospital admissions and emergency department visits are still going up as well, though these metrics are reported with two-week delays.

    The CDC updated its variant data this week, reporting that Omicron EG.5 continues to outcompete other XBB lineages. EG.5 doesn’t have a huge advantage in transmission, though, so it’s increasing relatively slowly amid a sea of other similar variants.

    But a new variant, called BA.2.86, may be one to watch more closely. Health officials are on the alert after seeing just a few cases in the U.S., Israel, and Denmark due to a number of mutations in this variant’s spike protein, which diverge significantly from other strains. (More on this variant later in today’s issue.)

    While the CDC says it’s monitoring this new variant, the agency’s genomic surveillance is far sparser than it was a year or two ago. The agency and its research partners are now sequencing under 5,000 coronavirus samples a week, compared to almost 100,000 a week at the height of Omicron. With this small sample pool, the CDC is less equipped to catch BA.2.86, or any other variants that may arise.

  • National numbers, August 13

    National numbers, August 13

    Wastewater data from Biobot Analytics suggest that coronavirus levels in the Northeast and South may be leveling off, while the Midwest is seeing a major spike.

    During the most recent week of data available (July 23 through 29), the U.S. reported about 9,000 new COVID-19 patients admitted to hospitals, according to the CDC. This amounts to:

    • An average of 1,300 new admissions each day
    • 2.8 total admissions for every 100,000 Americans
    • 13% more new admissions than the prior week (July 16-22)

    Additionally, the U.S. reported:

    • 10.6% of tests in the CDC’s surveillance network came back positive
    • A 9% higher concentration of SARS-CoV-2 in wastewater than last week (as of August 9, per Biobot’s dashboard)
    • 31% of new cases are caused by Omicron XBB.1.6; 17% by EG.5; 11% by XBB.2.3; 10% by XBB.1.9 (as of August 5)

    All major COVID-19 metrics continue to increase in the U.S., as we deal with a late-summer surge. Wastewater surveillance suggests that current virus spread is on pace with the Delta surge in 2021, though other data sources are less reliable these days.

    Wastewater data from Biobot continue to show an uptick nationally, following the same upward trend that started in late June. The CDC’s wastewater surveillance system and WastewaterSCAN network report similar trends.

    Biobot’s regional data suggest that the Northeast and South, the first two regions to see COVID-19 increases this summer, might be approaching their peaks, but it’s too early to say for sure. Regional test positivity numbers, from the CDC, show no sign of slowing their rise.

    Meanwhile, COVID-19 spread is going way up in the Midwest, per Biobot and WastewaterSCAN. Some sewersheds in Iowa, Michigan, Ohio, and nearby states have reported their viral levels in wastewater more than doubling over the last couple of weeks.

    Test positivity nationwide is now over 10%, per the latest data from the CDC’s respiratory virus testing network. Walgreens’ COVID-19 dashboard, which displays testing data from its pharmacies (i.e. a smaller sample size than the CDC network), reports a record high: of about 2,400 COVID-19 tests conducted in the week ending August 6, 45% were positive.

    Hospital admissions for COVID-19 are also on the rise, with about 1,300 new hospitalizations for COVID-19 each day in the week ending July 29, per the CDC. While it’s true that these numbers are far lower than peaks during prior surges, the data are also less reliable now— with fewer hospitals reporting to the CDC and fewer measures in those hospitals (like masking) to control infections.

    A lot of articles in the last couple of weeks have connected the recent surge to EG.5, the latest Omicron subvariant gaining ground in the U.S. However, this variant is not necessarily causing the surge; it doesn’t seem to be meaningfully more contagious or more severe than other recent strains, scientists are finding.

    Rather than a variant, I would personally attribute this surge to summer travel and gatherings, combined with waning immunity—it’s been many months since most Americans had contact with the virus through vaccination or infection.

    All of the virus-spreading activities going on right now will give SARS-CoV-2 more avenues to mutate. And there are other variants circulating globally that could cause more problems in the U.S. as well, as Eric Topol outlines in a recent Substack post. The next booster can’t come soon enough.

  • National numbers, August 6

    National numbers, August 6

    Test positivity is way up in the U.S., while hospitalizations are starting to follow this trend. Chart via the CDC.

    During the most recent week of data available (July 16 through 22), the U.S. reported about 8,000 new COVID-19 patients admitted to hospitals, according to the CDC. This amounts to:

    • An average of 1,150 new admissions each day
    • 2.4 total admissions for every 100,000 Americans
    • 12% more new admissions than the prior week (July 9-15)

    Additionally, the U.S. reported:

    • 8.9% of tests in the CDC’s surveillance network came back positive
    • A 10% higher concentration of SARS-CoV-2 in wastewater than last week (as of August 2, per Biobot’s dashboard)
    • 31% of new cases are caused by Omicron XBB.1.6; 17% by EG.5; 11% by XBB.2.3; 10% by XBB.1.9 (as of August 5)

    Over the last few weeks, the signals of a summer COVID-19 surge in the U.S. have grown steadily clearer. Viral levels in wastewater, test positivity, and hospitalizations are all climbing across the country.

    Wastewater surveillance data from Biobot suggest that coronavirus levels have doubled nationally in the last month. The surge is impacting all major regions of the country; the Northeast and South saw earlier increases, but the Midwest and West Coast are now catching up.

    The CDC’s wastewater surveillance network also points to increasing COVID-19 spread, with sites across the country reporting higher viral levels. While wastewater surveillance remains uneven (some states are testing in every county, others in just a handful of locations), it still gives us enough information to identify a widespread surge.

    Test positivity from the CDC’s lab testing network shows continued increases as well. About 8.9% of COVID-19 tests reported to the agency returned positive results in the week ending July 29, compared to 4.5% in the week ending June 24. This increase, too, is consistent across regions.

    Hospitalizations for COVID-19 are also going up, according to the CDC. These data are significantly delayed, with the most recent numbers dating to about two weeks ago. So, while overall patient numbers remain low right now, I expect they will continue to rise as the surge goes on.

    The coronavirus’ continued evolution is likely playing a role in this summer’s increased spread, as are summer travel and waning immunity from past vaccinations. Omicron EG.5, a descendant of the XBB.1.9 lineage, is the latest variant to spread widely, according to the CDC’s estimates.

    No one version of XBB has yet shown a significant ability to spread much faster or cause more severe symptoms than other variants. Rather, many iterations of this Omicron lineage are spreading in tandem, continuing to mutate with every infection. And with fewer PCR tests happening, it’s harder for health agencies to keep track.

    This summer’s surge may be less visible than ever. But wastewater data suggest we’re seeing similar levels of COVID-19 spread as we saw with Delta in summer 2021. Precautions are still important!