Tag: December data

  • National numbers, December 18

    National numbers, December 18

    Biobot’s wastewater surveillance data suggest that COVID-19 spread is trending down in the West coast and plateauing in other regions. Data as of December 15.

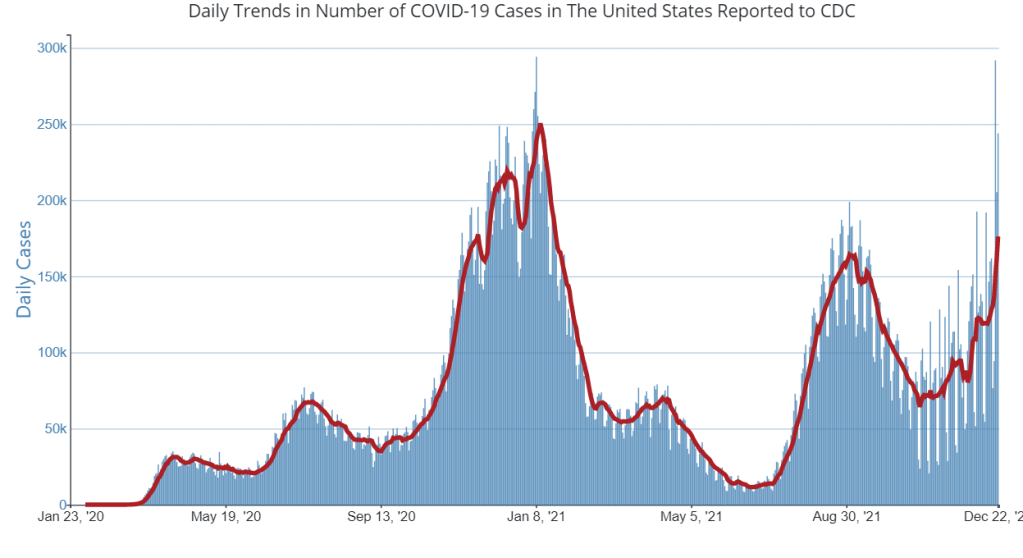
    In the past week (December 8 through 14), the U.S. reported about 460,000 new COVID-19 cases, according to the CDC. This amounts to:

    • An average of 65,000 new cases each day
    • 139 total new cases for every 100,000 Americans
    • 3% fewer new cases than last week (December 1-7)

    In the past week, the U.S. also reported about 35,000 new COVID-19 patients admitted to hospitals. This amounts to:

    • An average of 5,000 new admissions each day
    • 10.7 total admissions for every 100,000 Americans
    • 2% more new admissions than last week

    Additionally, the U.S. reported:

    • 2,700 new COVID-19 deaths (390 per day)
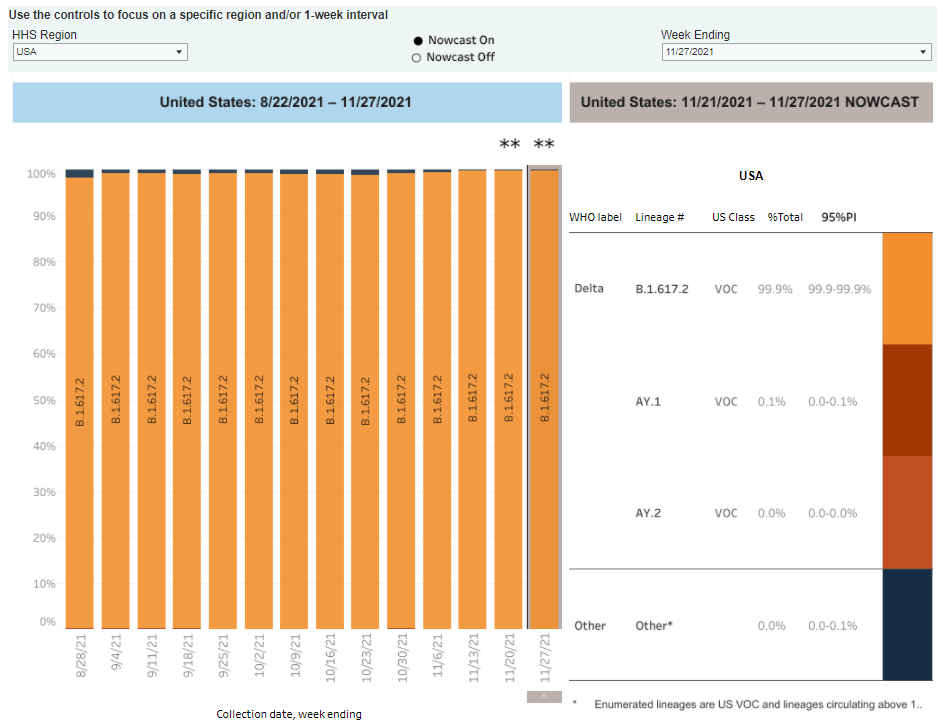
    • 69% of new cases are caused by Omicron BQ.1 and BQ.1.1; 5% by BF.7; 7% by XBB (as of December 17)
    • An average of 250,000 vaccinations per day (CDC link)

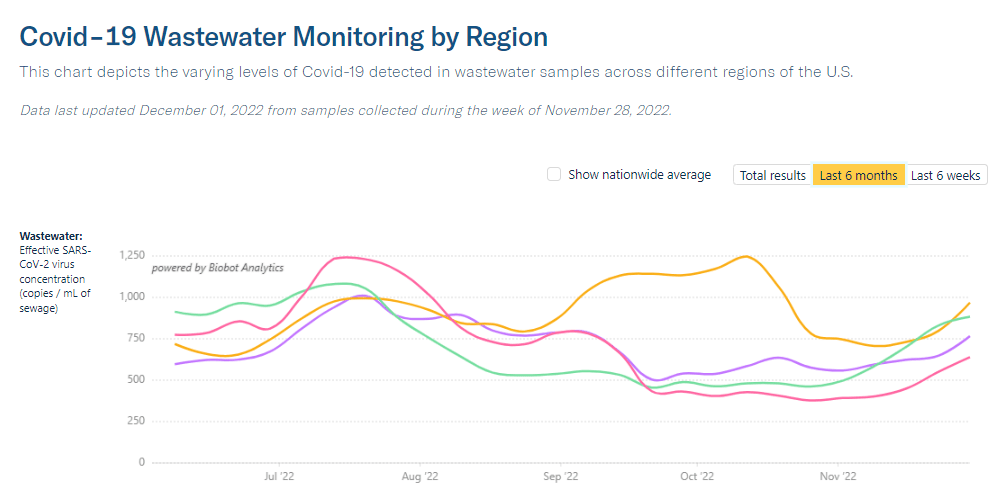
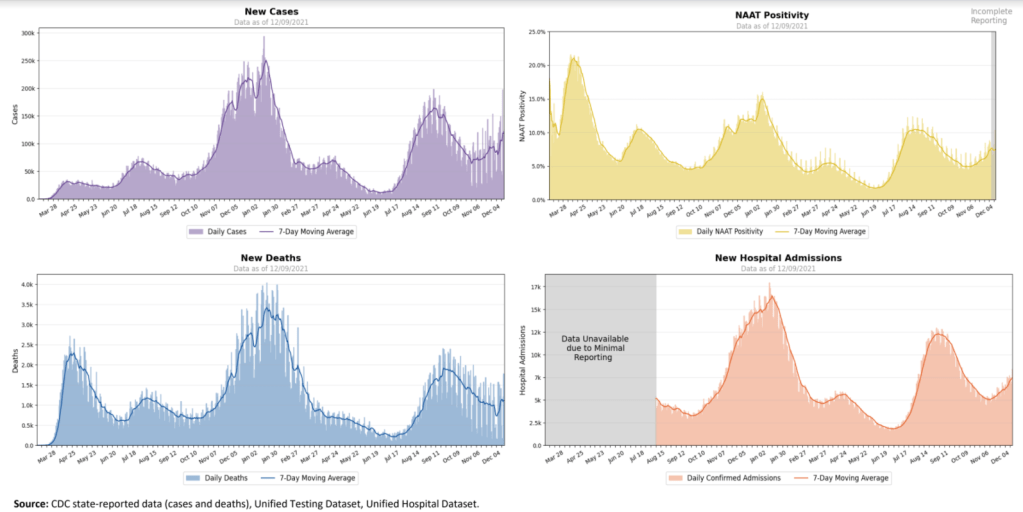
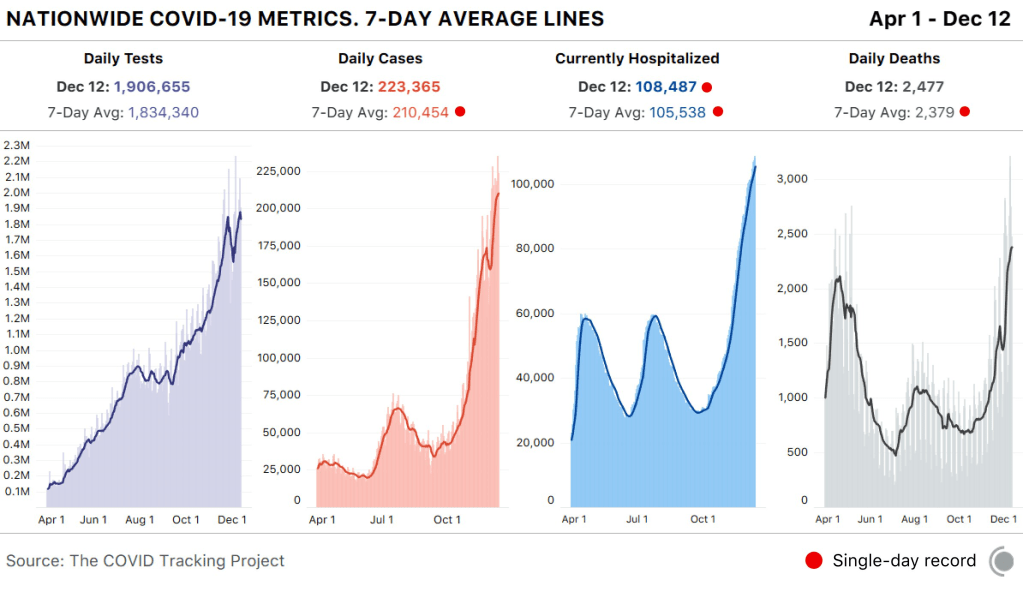
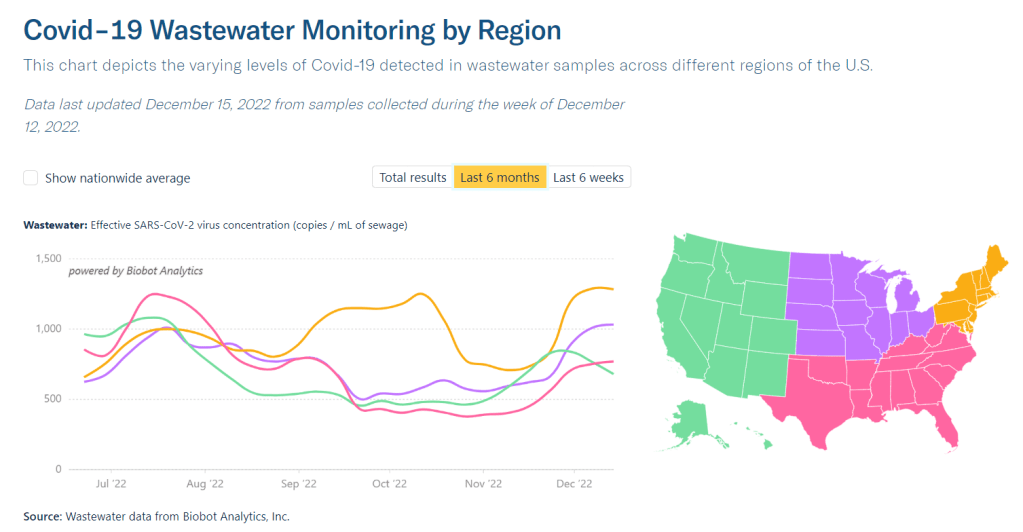
    After a significant post-Thanksgiving spike, COVID-19 transmission in the U.S. appears to be in a high plateau, according to trends in cases and wastewater. Official case counts stayed fairly steady this week compared to the week following the holiday, according to the CDC, while wastewater data from Biobot show coronavirus concentrations leveling out.

    COVID-19 hospital admissions are similarly at a high plateau: about 5,000 new people with COVID-19 were admitted to hospitals every day last week, per the CDC. That’s a 2% increase from last week.

    Going beyond the national trends, though, we see that some places are experiencing dips in COVID-19 spread while others are spiking. In Boston, for example, wastewater data suggest that COVID-19 is at its most prevalent since the surge in early summer. Across the country in Los Angeles, coronavirus levels in wastewater are trending down after increasing through November.

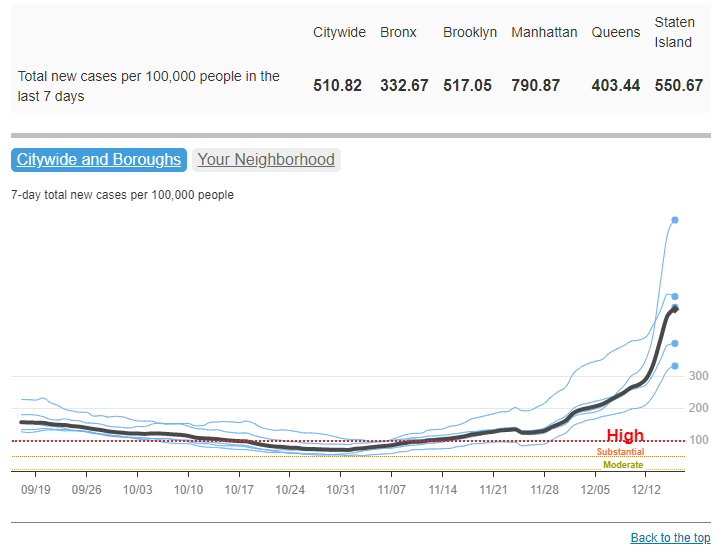
    New York and New Jersey had the highest official COVID-19 case rates in the last week, according to the latest Community Profile Report, followed by Illinois, California, and Rhode Island. But these data may be more a product of which states still have somewhat-available PCR testing than actual case comparisons.

    And even in places where COVID-19 is declining, the combined threat of this virus, flu, and RSV is still putting a lot of strain on healthcare systems. Take Los Angeles: while it might not be seeing record COVID-19 cases, the city currently has fewer free hospital beds available than at any other point in the pandemic, per reporting by the Los Angeles Times.

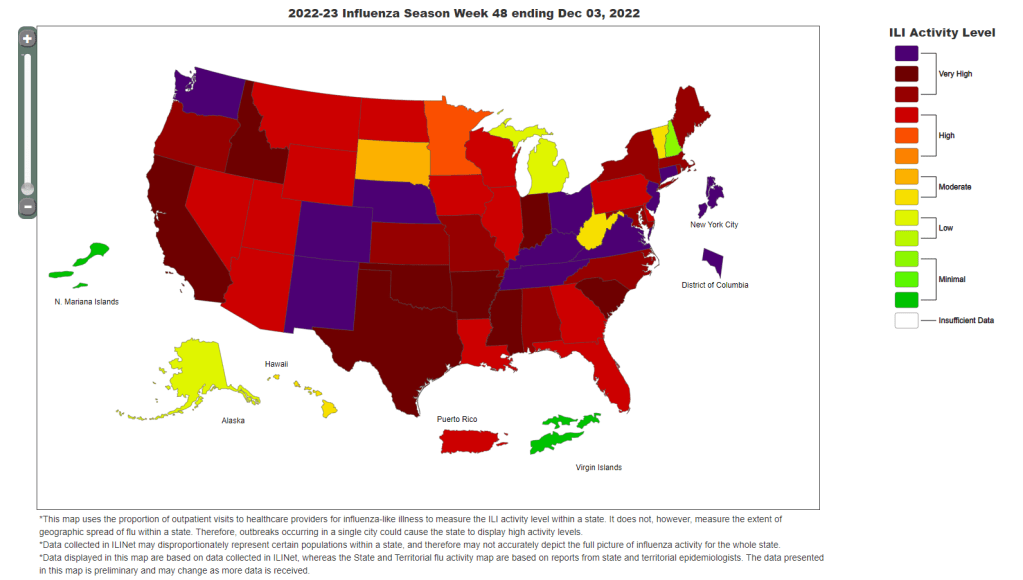
    Flu might be peaking in some parts of the country, Helen Branswell wrote in STAT on Friday, based on CDC data. But it’s still early in the typical flu season, and hard to tell how COVID-19 and the flu (and RSV) might impact each other.

    As we gear up for another week of holiday travel and gatherings—and as highly contagious Omicron subvariants, the BQs and XBB, continue to outcompete other versions of the virus—this is an important time to take all possible safety precautions.

    That includes getting your flu shot and the new Omicron-specific COVID-19 booster, which further CDC studies have shown is highly effective at preventing hospitalization. And it includes masking, testing before and after events, and gathering outdoors (or otherwise improving ventilation) to reduce your risk of spreading all kinds of viruses.

  • National numbers, December 11

    National numbers, December 11

    The CDC’s influenza-like illness map shows that the vast majority of the country is facing either high or very high levels of respiratory disease.

    In the past week (December 1 through 7), the U.S. reported about 460,000 new COVID-19 cases, according to the CDC. This amounts to:

    • An average of 66,000 new cases each day
    • 140 total new cases for every 100,000 Americans
    • 50% more new cases than last week (November 24-30)

    In the past week, the U.S. also reported about 34,000 new COVID-19 patients admitted to hospitals. This amounts to:

    • An average of 4,800 new admissions each day
    • 10.3 total admissions for every 100,000 Americans
    • 14% more new admissions than last week

    Additionally, the U.S. reported:

    • 3,000 new COVID-19 deaths (430 per day)
    • 68% of new cases are caused by Omicron BQ.1 and BQ.1.1; 6% by BF.7; 4% by BN.1;  5% by XBB (as of December 10)
    • An average of 300,000 vaccinations per day

    It’s now undeniable that Thanksgiving led to a jump in COVID-19 spread: officially-reported cases went up 50% this past week compared to the week of the holiday, following the trend that we first saw in wastewater data. Hospital admissions for COVID-19 also continue to go up.

    As always, it’s important to remember that official case counts are significantly underreported, due to dwindling access to (and interest in) PCR testing. So, the CDC’s estimate of 66,000 new COVID-19 cases each day likely amounts to over a million actual new infections each day. And that’s adding to the surges of flu, RSV, and other respiratory viruses already going strong.

    “Levels of flu-like illness, which includes people going to the doctor with a fever and a cough or sore throat, are at either high or very high levels in 47 jurisdictions,” CDC Director Dr. Rochelle Walensky said at a media briefing last Monday. That “flu-like illness” metric, shown on the CDC’s flu dashboard, is primarily used as an estimate of flu cases, but in our era of under-testing it likely includes COVID-19 and other viruses with similar symptoms.

    Dr. Walensky said that current hospitalizations for flu are the highest they’ve been in a decade for this time of year, indicating that the U.S. is having a bad flu season earlier in the winter than usual. According to Inside Medicine, flu hospitalizations actually overtook COVID-19 hospitalizations for the first time in the pandemic recently; though this trend could reverse as COVID-19 spreads more.

    The flu surge could peak and give us a milder January, or it could continue to go up from here—it’s currently hard to say. Flu vaccination rates have been low this year, which doesn’t help. CDC officials highlighted the benefits of both the flu vaccine and the updated COVID-19 booster shots at their briefing on Monday.

    Those updated COVID-19 boosters offer better protection against Omicron infection than prior vaccines, as real-world data has demonstrated. That should include protection against BQ.1 and BQ.1.1, the descendants of Omicron BA.5 that are currently causing the majority of cases in the U.S.—about 68% of new cases in the week ending December 10, per the CDC. XBB, the BA.2 subvariant that led to surges in Asian countries, is on the rise.

    Last week, wastewater data from Biobot showed a steep increase in COVID-19 spread. This week, the company’s dashboard suggests that this surge may have already peaked in some parts of the country. Was Thanksgiving the start of a major winter wave, or was it more of a holiday blip? Future weeks of data will help answer this.

  • National numbers, December 4

    National numbers, December 4

    All four major regions of the country are reporting increased coronavirus levels in their wastewater, per Biobot. Data as of November 28.

    In the past week (November 24 through 30), the U.S. reported about 303,000 new COVID-19 cases, according to the CDC. This amounts to:

    • An average of 43,000 new cases each day
    • 92 total new cases for every 100,000 Americans
    • 1% fewer new cases than last week (November 17-23)

    In the past week, the U.S. also reported about 29,000 new COVID-19 patients admitted to hospitals. This amounts to:

    • An average of 4,200 new admissions each day
    • 9.0 total admissions for every 100,000 Americans
    • 18% more new admissions than last week

    Additionally, the U.S. reported:

    • 1,800 new COVID-19 deaths (250 per day)
    • 63% of new cases are caused by Omicron BQ.1 and BQ.1.1; 6% by BF.7; 5% by BN.1;  6% by XBB (as of December 3)
    • An average of 200,000 vaccinations per day

    If the U.S. wasn’t at the start of a COVID-19 surge before Thanksgiving, we’re certainly in one now. While official case counts have stagnated, wastewater surveillance indicates that the country is seeing about 1.5 times the coronavirus transmission that we had three weeks ago, according to data from Biobot.

    All four major regions of the country are experiencing clear upward trends in COVID-19 spread, per Biobot, with no sign of peaking; this is the first time there’s been a unified national increase since mid-summer. Individual metropolitan areas from Boston, to the Twin Cities in Minnesota, to Los Angeles, are reporting major upticks.

    The current difference between wastewater surveillance trends and case trends further confirms what I’ve been saying for months: case data simply are no longer that helpful for seeing early warnings of surges, as few people seek out PCR testing compared to earlier points in the pandemic. If you don’t already have a good place to see wastewater data for your community, put some pressure on your local officials to make this information available.

    The U.S.’s new increase in transmission can likely be attributed to travel and gatherings over the Thanksgiving holiday, combined with newer, more-transmissible versions of Omicron. Lineages BQ.1 and BQ.1.1 caused almost two-thirds of new cases in the week ending December 3, according to CDC estimates, while XBB caused about 6% of new cases.

    XBB has been spreading intensely in some Asian countries, and experts are watching to see how it competes with the alphabet soup of subvariants already circulating in the U.S. So far, it is most prevalent in the Northeast, per the CDC.

    In addition to wastewater trends, new hospital admissions for COVID-19 went up this week: about 18% more patients were admitted to hospitals around the country in the week ending November 30 compared to the prior week. These patients are entering a hospital system already overwhelmed by flu, RSV, and other respiratory viruses.

    As epidemiologist Caitlin Rivers noted in her newsletter last week: “The cumulative hospitalization rate for influenza is already on par with where we would expect to be in December or January.” And that virus continues to spread further, with most of the country experiencing high or very high levels of influenza-like activity.

    COVID-19 and these other viruses might not seem like a big deal thanks to vaccines and treatments, but they can still have very severe consequences. For example, New York City just reported that three children died of COVID-19 in recent weeks. And the risk of Long COVID remains, too.

  • National numbers, December 26

    National numbers, December 26

    The seven-day average for new COVID-19 cases in the U.S. on December 23 has passed the peak of the Delta surge. Chart via the CDC.

    In the past week (December 17 through 23), the U.S. reported about 1.2 million new cases, according to the CDC.* This amounts to:

    • An average of 176,000 new cases each day
    • 376 total new cases for every 100,000 Americans
    • 42% more new cases than last week (December 10-16)

    Last week, America also saw:

    • 55,000 new COVID-19 patients admitted to hospitals (17 for every 100,000 people)
    • 8,500 new COVID-19 deaths (2.6 for every 100,000 people)
    • 73% of new cases are Omicron-caused (as of December 18)
    • An average of 1.4 million vaccinations per day (including booster shots; per Bloomberg)

    *This week’s update is based on data as of Thursday, December 23; I typically utilize the CDC’s Friday updates, but the agency is not updating any data from Friday through Sunday this week due to the Christmas holiday.

    Last week, the Omicron surge had clearly arrived; this week, it’s picking up steam. Nationwide, the U.S. reported well over one million new cases this week—more than a 40% increase from last week. 244,000 cases were reported on Thursday alone, and the daily new case average is now higher than at any point during the Delta surge.

    Hospitalization and death numbers have yet to increase so sharply: the number of new COVID-19 patients admitted to hospitals this week is up less than 1%, and the number of new COVID-19 deaths is up by about 4%.

    But when Omicron reaches those Americans who are more vulnerable to COVID-19, they’ll arrive at hospitals already overwhelmed from Delta, the flu, and nearly two years of pandemic burnout. At the same time, Omicron’s incredible capacity to spread will likely cause staffing shortages for many hospitals, as workers get breakthrough cases. On Thursday, the CDC announced that healthcare workers who get sick may shorten their quarantines if their facilities are facing shortages.

    New York City continues to be a major Omicron hotspot: according to city data, one in every 100 New Yorkers has tested positive for COVID-19 in the last week. In Manhattan, the number is one in 60. And these numbers don’t include people who tested positive on rapid at-home tests and weren’t able to confirm it with PCR. The city’s test positivity rate is over 10%, indicating that a lot of cases are going unreported in official data.

    Washington, D.C. has also emerged as a Omicron hotspot this week, with an average of over 1,000 new cases reported daily in the week ending December 22. That’s more than three times higher than the city’s case record at any other point during the pandemic. Meanwhile, several states have seen their case rates more than double in the past week, according to the latest Community Profile Report: Hawaii, Florida, Louisiana, Georgia, and Maryland.

    As Omicron sweeps across the country—aided by holiday travel and gatherings—we are about to face the reporting delays that come with every holiday. Public health workers from local agencies to the CDC are taking time off, while testing sites close for Christmas and millions of rapid tests go unreported.

    Erin Kissane, co-founder of the COVID Tracking Project, wrote about holiday data issues in The Atlantic this week. Her piece concludes:

    In this information vacuum, some of us will tend toward caution and others toward risk. By the time Americans find out the results of our collective actions, the country will have weeks of new cases—an unknown proportion of which will turn into hospitalizations and deaths—baked in. In the meantime, the CDC’s COVID Data Tracker Weekly Review has wished us all a safe and happy holiday and gone on break until January 7, 2022.

  • National numbers, December 19

    National numbers, December 19

    COVID-19 cases have increased sharply in New York City in the past week, to over 500 new cases for every 100,000 people city-wide. Chart via NYC Health, retrieved December 19.

    In the past week (December 11 through 17), the U.S. reported about 860,000 new cases, according to the CDC. This amounts to:

    • An average of 122,000 new cases each day
    • 261 total new cases for every 100,000 Americans
    • 2% more new cases than last week (December 4-10)

    Last week, America also saw:

    • 55,000 new COVID-19 patients admitted to hospitals (17 for every 100,000 people)
    • 8,300 new COVID-19 deaths (2.5 for every 100,000 people)
    • 2.9% of new cases are Omicron-caused (as of December 11)
    • An average of 1.6 million vaccinations per day (including booster shots; per Bloomberg)

    The Omicron surge has arrived in the U.S. While national COVID-19 cases are not significantly up from last week to this week, last week’s bump in the numbers from delayed Thanksgiving reporting has been replaced with a true increase, thanks to the combined pressures of both Delta and Omicron.

    Hospitalizations are also increasing, with about 60,000 Americans hospitalized with COVID-19 nationwide as of December 15—a 9% increase from the previous week. The number of Americans dying from COVID-19 each day is increasing as well, now at about 1,200 deaths a day.

    Omicron’s impact feels particularly pronounced in New York City, where I live, as the city’s case rate more than doubled in the first two weeks of December. This past week, the city’s test positivity rate doubled in the span of three days. Yesterday, New York state reported a record number of new COVID-19 cases (about 22,000), with more than half of those cases reported in NYC.

    To be fair, the case rates reported in NYC this week are probably lower than the true case rates during spring 2020, as testing wasn’t widely available during the city’s first COVID-19 surge. But on a personal level, this city’s current Omicron surge is undeniable: testing lines stretch around the block, and everyone from my old college friends to my local City Council representative is reporting a breakthrough case. I personally have yet to catch “the Media Variant,” but I’m rapid testing frequently and avoiding indoor activities as I prepare to visit my parents for Christmas.

    Omicron was causing 13% of new COVID-19 cases in New York and New Jersey in the week ending December 11. By today, it’s likely causing the majority of new cases. But the NYC region isn’t the only part of the country seeing rapid case increases: Hawaii, Florida, Connecticut, Maine, and D.C. have all reported more than a 30% increase in cases from the previous week to this one, according to the latest Community Profile Report. Rhode Island, New Hampshire, Maine, and other Northern states have the highest cases per capita.

    Vaccines, particularly booster shots, can protect against this dangerous variant (more on that later in this issue). While 61% of Americans are fully vaccinated, according to the CDC, less than 30% have received booster doses. This includes about 53% of Americans over 65, even though seniors were one of the first groups become eligible for boosters—and are among those most in need of this additional protection.

  • National numbers, December 12

    National numbers, December 12

    All major COVID-19 metrics shot up in the U.S. this week. Chart from the December 9 HHS Community Profile Report.

    In the past week (December 4 through 10), the U.S. reported about 830,000 new cases, according to the CDC. This amounts to:

    • An average of 119,000 new cases each day
    • 253 total new cases for every 100,000 Americans
    • 37% more new cases than last week (November 27-December 3)

    Last week, America also saw:

    • 52,000 new COVID-19 patients admitted to hospitals (16 for every 100,000 people)
    • 7,600 new COVID-19 deaths (2.3 for every 100,000 people)
    • 99.9% of new cases are Delta-caused (as of December 4)
    • An average of 2.3 million vaccinations per day (including booster shots; per Bloomberg)

    Remember how, last week, I said that the dip in the CDC’s case counts was a vestige of Thanksgiving data delays—and we’d see more cases in the next week? Well, we’re seeing those cases now. Cases have increased by 37% from last week to this week, and they’ve increased by 55% in the last month.

    Hospitalizations are also going up: the number of new COVID-19 patients admitted to hospitals each day has risen 16%, to over 7,000. About 56,000 people are currently hospitalized with COVID-19 in the U.S., as of Thursday. And, tragically, death counts are rising as well: once again, over 1,000 Americans are dying from COVID-19 every day.

    Current hotspots include states in the Northeast and Midwest. New Hampshire reported the most cases per capita last week, at 659 new cases for every 100,000 people, per the latest Community Profile Report. Michigan, Minnesota, Rhode Island, and New Mexico also all reported over 500 new cases for every 100,000 people.

    In many parts of the country, COVID-19 patients have once again pushed hospitals to their breaking points, as the pandemic intersects with staff shortages and burnout as well as flu and other conditions. “We’re at capacity on a daily basis,” the president of a hospital system in Detroit told a local reporter.

    Despite growing Omicron concerns (more on that later), the Delta variant is clearly driving this surge. According to the CDC’s estimates, the Delta variant has caused more than 99% of cases in the week ending December 4, while Omicron has yet to cause even 0.1%. If Omicron is able to outcompete Delta in the U.S., the situation could become even more dire.

    It’s now been two years since a COVID-19 patient first sought medical attention, at a hospital in Wuhan, China. Though most Americans didn’t become aware of the pandemic until March 2020, the coronavirus was already spreading in December 2019—meaning that now, in December 2021, we’re entering Year Three of this global crisis. I hope this can be the year that we get vaccines to every country in the world, and truly get the virus under control.

  • National numbers, December 5

    National numbers, December 5

    Though Omicron is making headlines, Delta is still causing 100% of COVID-19 cases in the U.S. Chart via the CDC, screenshot taken on December 5.

    In the past week (November 27 through December 3), the U.S. reported about 600,000 new cases, according to the CDC. This amounts to:

    • An average of 86,000 new cases each day
    • 184 total new cases for every 100,000 Americans
    • 8% fewer new cases than last week (November 20-26)

    Last week, America also saw:

    • 45,000 new COVID-19 patients admitted to hospitals (14 for every 100,000 people)
    • 6,000 new COVID-19 deaths (1.8 for every 100,000 people)
    • 100% of new cases are Delta-caused (as of November 27)
    • An average of one million vaccinations per day (including booster shots; per Bloomberg)

    Don’t be fooled by the apparent case decline in the CDC’s numbers: the U.S. is still in the midst of a new surge. The agency reported fewer cases last week due to Thanksgiving holiday delays, but we can expect cases to shoot up next week as delayed cases are added to the data.

    I use the CDC for these updates because I find the national agency’s data reliable and easy to access, but the CDC does tend to be more heavily impacted by reporting delays than other sources which compile numbers from U.S. states or counties. For example, the New York Times is reporting a daily new case average of 108,000 as of December 4, while BNO Newsroom has reported over 100,000 new cases for five days in a row.

    Meanwhile, hospitalizations are ticking up: with 45,000 new COVID-19 patients admitted to U.S. hospitals last week and almost 50,000 people currently hospitalized, as of December 2. Hospitalizations are one COVID-19 metric that tends to be less impacted by holidays, as the hospitals collecting these data don’t take days off.

    Northern states continue to lead the country in new cases per capita. According to the latest Community Profile Report, top hotspots are New Hampshire, Michigan, Minnesota, North Dakota, and Wisconsin. New Hampshire reported over 500 new cases for every 100,000 people in the last week, and is continually setting new COVID-19 records.

    Michigan is seeing more cases now than it has in any previous surge, and the state’s hospital systems—like many others—are facing dire staff shortages, along with increased numbers of flu patients. The state has almost 900 fewer staffed hospital beds now than in November 2020, according to ABC News.

    While the Omicron variant has now been identified in more than ten U.S. states (more on that below), the Delta variant is still driving this current surge. According to the CDC’s latest variant data, 100% of new cases in the country are caused by Delta. In the coming weeks, we’ll see how much Omicron is able to compete.

  • National numbers, Dec. 27

    National numbers, Dec. 27

    National numbers

    In the past week (December 20 through 26), the U.S. reported about 1.3 million new cases, according to the COVID Tracking Project. This amounts to:

    • An average of 186,000 new cases each day
    • 397 total new cases for every 100,000 Americans
    • 1 in 252 Americans getting diagnosed with COVID-19 in the past week
    Four bar charts showing key COVID-19 metrics for the US for April 1 to December 26. Today, states reported 2.1M tests, 189k cases, 117,344 currently hospitalized, and 1,409 deaths.
    Nationwide COVID-19 metrics published in the COVID Tracking Project’s daily update on December 26.

    Last week, America also saw:

    • 117,000 people now hospitalized with COVID-19 (36 for every 100,000 people)
    • 15,600 new COVID-19 deaths (4.7 for every 100,000 people)

    Around Thanksgiving, I wrote that COVID-19 data would likely get weird during and after the holiday. When the public health officials who compile and publish COVID-19 counts take a (well deserved!) day or two off, the cases, tests, and deaths that were not reported on those days off will be belatedly added to post-holiday counts. Here’s a COVID Tracking Project blog post that explains the trend in more detail.

    This pattern did, in fact, come to pass after Thanksgiving: the week of the holiday, 1.1 million cases were reported, followed by 1.3 million cases the next week and 1.6 million the week after that. We should expect this to happen once again over Christmas; indeed, the COVID Tracking Project noted that 20 states did not report COVID-19 data on December 25. The true impact of over a million people traveling will not be seen in the data for weeks to come.

    But while public health agencies may take a day off, hospitals never close. This week, more Americans were hospitalized with COVID-19 than ever: the number peaked on December 24, at over 120,000. That’s double the highest national patient number we saw in the spring or summer.

    Over 3 million Americans died in 2020—the highest number of lives lost in one year since the nation began this morbid count. At least 323,000 of those deaths were directly caused by the novel coronavirus.

  • National numbers, Dec. 20

    National numbers, Dec. 20

    In the past week (December 13 through 19), the U.S. reported about 1.5 million new cases, according to the COVID Tracking Project. This amounts to:

    • An average of 211,000 new cases each day
    • 451 total new cases for every 100,000 Americans
    • 1 in 222 Americans getting diagnosed with COVID-19 in the past week
    • 39% of the total cases reported across the globe this week, according to the World Health Organization
    4 bar charts showing key COVID-19 metrics for the US over time from April 1 to December 19. Today, states reported 1.7M tests, 202k cases, 113,929 currently hospitalized, and 2,704 deaths.
    Nationwide COVID-19 metrics published in the COVID Tracking Project’s daily update on December 19. Seven-day averages for hospitalizations and deaths are at all-time highs.

    Cases appear to be slowing nationwide, the Project’s weekly update reports—but the trend should be interpreted with caution, as many cases reported last week were delayed by the Thanksgiving holiday. And national counts obscure regional patterns: while the Midwest may have finally passed its peak of new cases, the Northeast, South, and West are all facing still-rising outbreaks. California alone reported 287,000 cases this week, and the state’s hospitals are already full.

    Last week, America also saw:

    • 114,000 people now hospitalized with COVID-19 (35 for every 100,000 people)
    • 18,300 new COVID-19 deaths (5.6 for every 100,000 people)

    The nation continues to pass its own record for deaths reported in a single week. COVID-19 is, unambiguously, the leading cause of death in the U.S. right now.

  • National numbers, Dec. 13

    National numbers, Dec. 13

    In the past week (December 6 through 12), the U.S. reported about 1.6 million new cases, according to the COVID Tracking Project. This amounts to:

    • An average of 228,000 new cases each day (23% increase from the previous week)
    • 487 total new cases for every 100,000 Americans
    • 1 in 205 Americans getting diagnosed with COVID-19 in the past week
    • 44% of the total cases reported across the globe this week, according to the World Health Organization
    4 bar charts showing key COVID-19 metrics for the US over time. Today, states reported 1.9M tests, 223k cases, 108,487 currently hospitalized (record), and 2,477 deaths.
    Nationwide COVID-19 metrics published in the COVID Tracking Project’s daily update on December 12. Seven-day averages for cases, deaths, and hospitalizations are all at all-time highs.

    In the month of November, one in 74 Americans was diagnosed with COVID-19. This terrible rise in cases has already put enormous strain on the nation’s healthcare system, and the outbreak is not slowing down. One in 131 Americans was diagnosed with COVID-19 in the first 12 days of December alone.

    Last week, America also saw:

    • 108,500 people now hospitalized with COVID-19 (33.1 for every 100,000 people)
    • 17,300 new COVID-19 deaths (5.3 for every 100,000 people)

    In last Sunday’s issue, I reported that 15,000 deaths in one week marked a national record; this week, we saw 2,000 more. How do you think about numbers this big? You could compare the pandemic to 9/11, Pearl Harbor, and other American tragedies, but even this practice minimizes the fact that a day of 3,000 deaths is only one day in a year of mass suffering.

    Stay safe out there, readers. Stay well. Stay kind.