American Oversight, a nonprofit watchdog organization that shares government information through public records requests, recently reached a settlement in a lawsuit with the CDC. The settlement’s terms will make it easier for anyone requesting CDC documents to get results.
Early in the pandemic, American Oversight filed a number of FOIA (Freedom of Information Act) requests to the CDC about the agency’s COVID-19 response. Some of those requests were rejected for being “overly broad,” which demonstrated “significant problems with the agency’s FOIA practices” and led to American Oversight filing a lawsuit in May 2020, the organization explains in a recent blog post.
The CDC and American Oversight have now reached a settlement about this records lawsuit—and its terms require the agency to instruct all CDC FOIA officers to be more considerate of “broad” requests. Rather than issuing blanket rejections, FOIA officers should look closely at request descriptions and consult with their supervisors “to ensure all angles of the request have been considered,” according to an email that CDC leadership has sent to staff, in consultation with American Oversight.
This settlement could have huge ramifications for other people requesting records from the CDC (including yours truly) as journalists and researchers continue to investigate how the U.S. handled COVID-19. Thank you to American Oversight for pushing on transparency!
COVID-19 polling data from Axios/Ipsos: During the workshop I led at NICAR last weekend, one attendee (who works at the market research company Ipsos) recommended that journalists and researchers interested in Long COVID data should check out the Axios/Ipsos polling project to track American attitudes on COVID-19. Recent iterations of the poll have included questions about Long COVID, and the polling results are broken out by demographics (age, race, houeshold income). The surveys ask many other COVID-19 questions as well, such as attitudes about masking. To access the data, you can download PDFs from the Ipsos site or spreadsheets from Roper.
CDC provides guidance for Long COVID deaths: The CDC National Center for Health Statistics has started to add information about Long COVID to its guidance for death certificates, following a report that the agency published in December about deaths from Long COVID. The guidance now explains that SARS-CoV-2 “can have lasting effects on nearly every organ and organ system of the body weeks, months, and potentially years after infection,” and can contribute to premature death months or years after a patient’s original infection. For context, see MuckRock’s report on Long COVID deaths from December.
Long COVID gastrointestinal symptoms: Ziyad Al-Aly and his team at the Veterans Affairs St. Louis Health Care System have a new paper in Nature about long-term gastrointestinal symptoms following COVID-19. Using the VA electronic health records database, the researchers compared 150,000 people who’d had COVID-19 to millions of controls. They found people with COVID-19 had elevated risks of many gastrointestinal disorders (including acid-related illness, intestinal disorders, pancreatitis, and more) in the year following their acute cases, compared to the controls. GI symptoms have long been an under-publicized aspect of COVID-19 and Long COVID.
Clinical trial for Long COVID shows promising results: And one more Long COVID study: researchers at the University of Minnesota examined the potential for three common medications to lower risk of Long COVID. This study was a blinded, randomized control trial—the gold standard of medical research. One of the drugs tested, metformin (which is a common medication for type 2 diabetes), led to a significantly lower risk of Long COVID compared to the placebo. The study hasn’t yet been peer-reviewed, but it shows promising results for metformin as a potential Long COVID treatment option.
Examining trust in public health agencies: Another new paper, published this week in Health Affairs, shares results from a survey of about 4,200 U.S. adults (a nationally representative sample) about trust in public health agencies. The survey suggested that trust in federal agencies is connected to perceptions of scientific expertise, while trust in state and local agencies is more tied to “perceptions of hard work, compassionate policy, and direct services.” Survey respondents who reported the least trust in public health cied concerns about political influence, private sector influence, inconsistency, and excessive restrictions.
Some parents lied about children’s COVID-19 status: One more notable survey study, published this week in JAMA Network Open: researchers at Middlesex Community College (in Connecticut) and University of Utah Health, among other collaborators, surveyed a group of 1,700 U.S. parents about COVID-19 protective measures for their children. The study found about 26% of respondents reported lying about or misrepresenting their child’s COVID-19 status in order to break quarantine rules. Common motivations for this behavior were wanting to “exercise personal freedom as a parent,” not being able to miss work or other responsibilities, and wanting kids to have normal experiences. The results suggest “a serious public health challenge” for continued COVID-19 outbreaks and other infectious diseases, the paper’s authors write.
Maternal mortality during the pandemic: MuckRock (where I work part-time) has published new analysis showing a significant increase in maternal deaths during the COVID-19 pandemic, based on CDC mortality data. The death rate for women ages 15 to 44 went from about 29 deaths per 100,000 births in 2019 to 46 deaths per 100,000 births in 2021. Death rates were significantly higher for Black women and in states with more restrictive policies on maternal healthcare. You can find the full analysis (including a selection of state-level data) here.
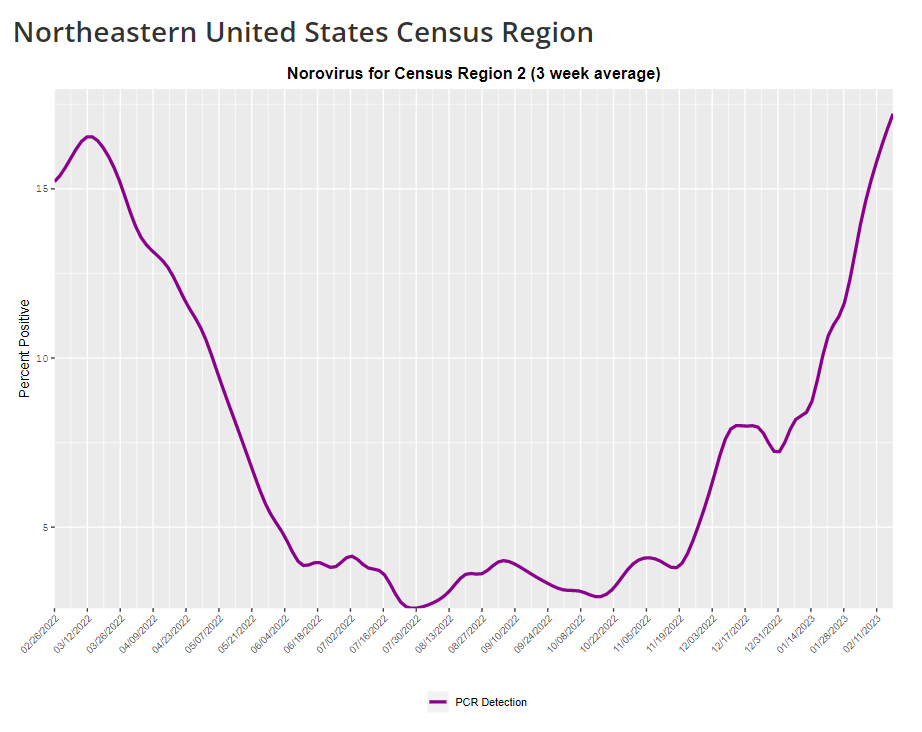
The CDC provides norovirus test positivity data from a select number of labs that report test results for this virus. Due to limited reporting, data are only available at the regional level.
This week, I have a new story out in Gothamist and WNYC (New York City’s public radio station) about norovirus, a nasty stomach bug that appears to be spreading a lot in the U.S. right now. The story shares some NYC-specific norovirus information, but it also talks more broadly about why it’s difficult to find precise data on this virus despite its major implications for public health.
Reporting this story led me to reflect on how COVID-19 has revealed cracks in the country’s infrastructure for tracking a lot of common pathogens. I’ve written previously about how the U.S. public health system monitored COVID-19 more comprehensively than any other disease in history; the scale of testing, contact tracing, and innovation into new surveillance technologies went far beyond the previous standards. Now, people who’ve gotten used to detailed data on COVID-19 have been surprised to find out that such data aren’t available for other common pathogens, like the flu or norovirus.
It might feel disappointing to realize how little we actually know about the impacts of endemic diseases. But I choose to see this as an opportunity: as COVID-19 revealed gaps in public health surveillance, it inspired development in potential avenues to close those gaps. Wastewater surveillance is one big example, along with the rise of at-home tests and self-reporting mechanisms, better connectivity between health systems, mobility data, exposure notifications, and more.
Norovirus is a good example of this trend. Here are a few main findings from my story:
People who become infected with norovirus are often hesitant to seek medical care, because the symptoms are disgusting and embarrassing. Think projectile vomit, paired with intense diarrhea.
Even when patients do seek medical care, norovirus tests are not widely available, and there isn’t a ton of incentive for doctors to ask for them. Testing usually requires a stool sample, which patients are often hesitant to do, one expert told me.
The virus is not a “reportable illness” for the CDC, meaning that health agencies and individual doctors aren’t required to report norovirus cases to a national monitoring system. (So even when a patient tests positive for norovirus, that result might not actually go to a health agency.)
The CDC does require health agencies and providers to report norovirus outbreaks (i.e. two or more cases from the same source), but national outbreak estimates are considered to be a vast undercount of true numbers.
Even in NYC, where the city’s health agency does require reporting of norovirus cases, there’s no recent public data from test results or outbreaks. (The latest data is from 2020.)
It seems like the lack of a requirement and the difficulty of tracking kind-of play into each other, where it’s not required because it’s hard to track—but it’s also hard to track because it’s not required.
The lack of detailed data on pathogens like norovirus can be frustrating on an individual level, for health-conscious people who might want to know what’s spreading in their community so that they can take appropriate precautions. (For norovirus, precautions primarily include rigorous handwashing—hand sanitizer doesn’t work against it—along with cleaning surfaces and care around food.)
These data gaps can also be a challenge for public officials, as more detailed information about where exactly a virus is spreading or who’s getting sick could inform specific public health responses. For example, if the NYC health department knew which neighborhoods were seeing the most norovirus, they could direct handwashing PSAs to those areas. In addition, scientists who are developing norovirus vaccines could use better data to estimate the value of those products, and determine who would most benefit.
So, how do we improve surveillance for norovirus and other viruses like it? Here are a few options I found in my reporting:
Wastewater surveillance, of course. The WastewaterSCAN project is already tracking norovirus along with coronavirus and several other common viruses; its data from this winter has aligned with other sources showing a national norovirus surge, one of the project’s principal investigators told me.
Better surveillance based on people’s symptoms. The Kinsa HealthWeather project offers one example; it aggregates anonymous information from smart thermometers and a symptom-tracking app to provide detailed data on respiratory illnesses and stomach bugs.
At-home tests, if they’re paired with a mechanism for people to report their results to a local public health agency. Even without a reporting mechanism, at-home tests could help curb outbreaks by helping people recognize their illness when they might be asymptomatic.
Simply increasing awareness and access to the tests that we already have. If more people go to the doctor for gastrointestinal symptoms and more doctors test for norovirus, our existing data would get more comprehensive.
Are there other options I’ve missed? Is there another pathogen that might be a good example of common surveillance issues? Reach out and let me know.
In the past week (February 16 through 22), the U.S. officially reported about 240,000 new COVID-19 cases, according to the CDC. This amounts to:
An average of 34,000 new cases each day
72 total new cases for every 100,000 Americans
9% fewer new cases than last week (February 9-15)
In the past week, the U.S. also reported about 25,000 new COVID-19 patients admitted to hospitals. This amounts to:
An average of 3,500 new admissions each day
7.5 total admissions for every 100,000 Americans
5% fewer new admissions than last week
Additionally, the U.S. reported:
2,400 new COVID-19 deaths (350 per day)
85% of new cases are caused by Omicron XBB.1.5; 12% by BQ.1 and BQ.1.1; 1% by CH.1.1 (as of February 25)
An average of 60,000 vaccinations per day
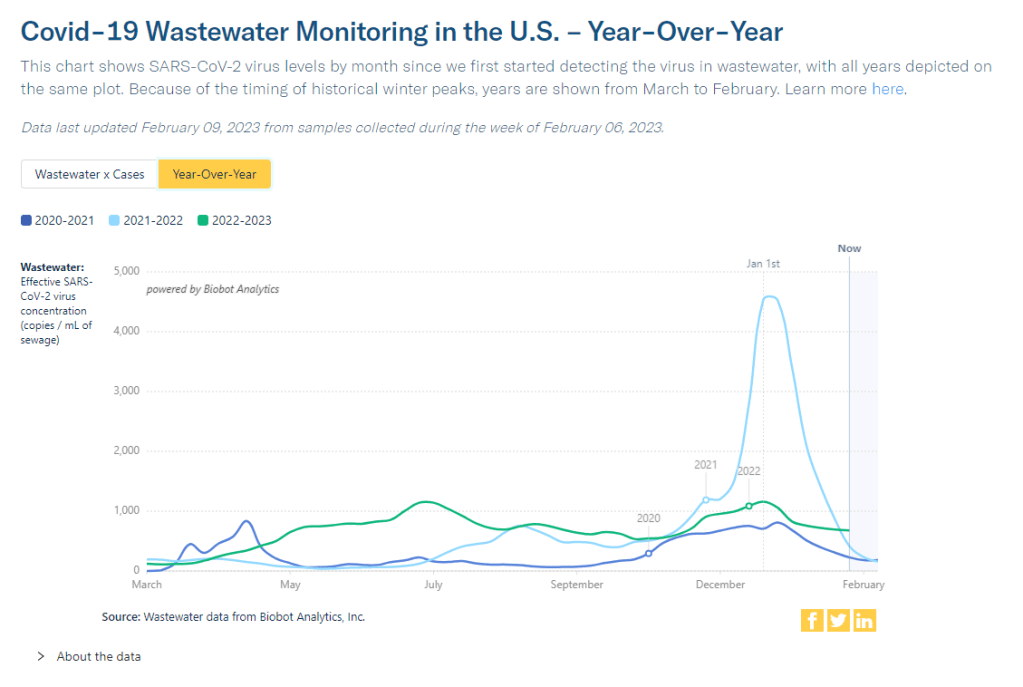
The national COVID-19 plateau continues. As I’ve been saying for a few weeks now, COVID-19 spread has dropped significantly from its high during the winter holidays, but it has not fallen to the low levels we’ve previously seen this time of year due to a combination of lax precautions and the latest Omicron variant, XBB.1.5.
Case and hospitalization data from the CDC, along with wastewater surveillance data, all show COVID-19 spread declining—but very slowly. Cases declined by 9% this week compared to the week prior, while new hospital admissions declined by 5%. Biobot’s wastewater surveillance dashboard shows slight declines or plateaus in all four major regions of the country.
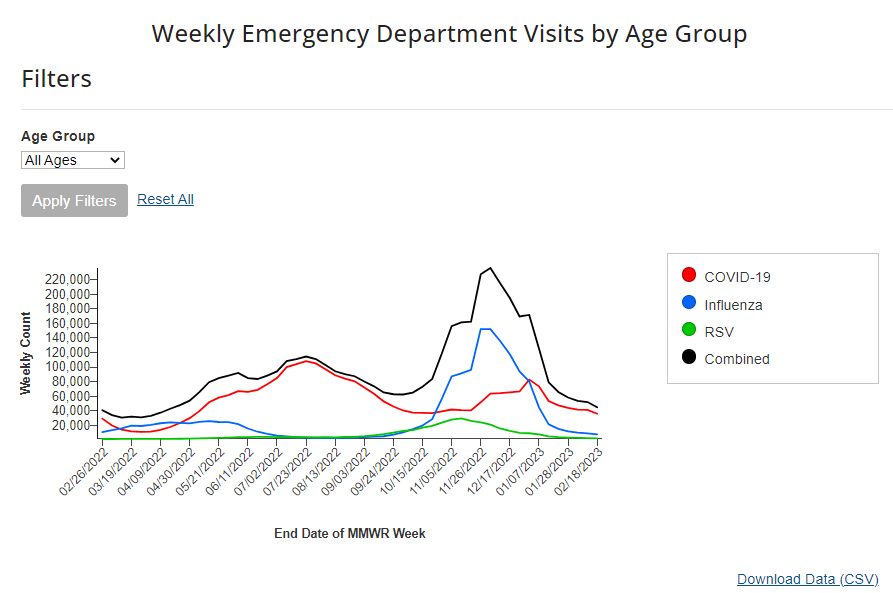
Respiratory virus season is clearly waning in the U.S., according to hospital emergency room visit data from the CDC’s National Syndromic Surveillance Program. ER visits for the flu and RSV have pretty much returned to baseline after their winter peaks. But COVID-19 ER visits have plateaued at a higher level, close to the visit numbers reported in September and October—another sign of the elevated “low tide” we’ve now been dealing with since spring 2022.
On the variant front: Omicron XBB.1.5 continues to dominate in the U.S. It caused an estimated 85% of new cases nationwide in the week ending February 25, according to the CDC, and is the main variant circulating in every region. After several months of “variant soup” with a number of Omicron subvariants competing, XBB.1.5 has emerged as the clear victor; no other single lineage is causing more than 10% of new cases in the country, per the CDC’s estimates.
I continue to write about COVID-19 case numbers from the CDC here, mostly because A) the directional patterns (i.e. upticks and downturns) of these data are still a decent representation of actual directional patterns in infections, and B) the CDC’s case numbers are more nationally representative (when it comes to geography) than data from the National Wastewater Surveillance System.
But I have to stress that these case numbers are increasingly undercounting actual infections. The last decent estimates I’ve seen comparing cases to infections, dated from last fall, suggested that case numbers are undercounted by a factor of 10 to 20. These days, I expect we’re likely closer to a factor of 20, if not higher. As evidence, test positivity for the entire U.S. has been at 10% for a couple of weeks now.
Other evidence for this continued undercounting comes from wastewater data. From resources like the Biobot dashboard, which compares wastewater surveillance trends to case trends, it’s abundantly clear that these two metrics used to align closely—but now coronavirus levels in wastewater are consistently much higher. In New York City, for example, wastewater data show that the city experienced one of its greatest COVID-19 surges this winter.
Hadn't run the NYC wastewater COVID numbers in a while, but was pretty surprised when I did.
I'd known there was a surge this winter, but didn't realize that Dec. 2022 wastewater concentrations were the *highest* since the start of the pandemic outside the omicron spike pic.twitter.com/lihRq8u5YU
Speaking of unreliable numbers: the team behind the CDC’s COVID Data Tracker Weekly Review has begun to update its readers on how the end of the federal public health emergency will impact COVID-19 data. The first update, published on Friday, explains that some data, including hospitalization and vaccination numbers, “may be reported less frequently” or with new gaps. I anticipate we’ll get more details about this in the coming weeks, as the CDC negotiates new data-sharing requirements with other health agencies.
The CDC’s data tracking newsletter is also shifting from a weekly newsletter to biweekly, starting March 3. It continues to boggle my mind how I, a single freelance journalist writing this publication in my spare time, am able to keep up more regular data updates than a massive federal agency.
Test positivity will become less reliable after PHE ends:CBS News COVID-19 reporter Alexander Tin flagged last week that, after the federal public health emergency for COVID-19 ends this spring, private labs that process PCR tests will no longer be required to report their results to state health departments. States will still report any results they get to the CDC, but federal officials expect that this data will become much less reliable, according to a background press briefing from the Department of Health and Human Services (HHS). Case data are already unreliable; soon, we won’t even have consistent test positivity data to tell us how unreliable they are. This may be one of several data sources that get worse after the end of the PHE.
HHS is supporting improved healthcare data sharing: The inability to connect different health records systems (or lack of interoperability, to use the technical term) has been a big problem during the pandemic, as researchers and health officials often couldn’t answer questions that require multiple health datasets. HHS has taken some steps to improve this situation, while also making it easier for individual patients to access their personal records. Most recently, HHS announced that it’s chosen six companies and organizations to develop data-sharing platforms, according to POLITICO. It’ll take some time for these organizations to start actually sharing data, but I’m glad to see any movement on this important issue.
Yes, vaccination is still the best way to get protected from COVID-19: A new study from the Institute for Health Metrics and Evaluation, published in the Lancet this week, has been making the rounds on social media recently. Anti-vax pundits are claiming the study shows that immunity from a prior coronavirus infection is more effective than immunity from vaccination at preventing future severe COVID-19. While the study does show that a prior infection can be helpful, the authors found a significant drop in the value of this type of protection after Omicron variants started circulating in late 2021. And, as some commentators have pointed out, infections can always lead to severe symptoms and Long COVID—the risks from vaccination are much lower. Basically, this XKCD comic remains accurate.
I got an interesting question from a reader last weekend, asking if excess deaths might be one way to identify the impact of Long COVID. It’s an interesting idea: could the numbers of deaths from medical causes above what researchers expect in a given timeframe indicate some premature deaths tied to Long COVID?
Based on my previous work with excess deaths (see MuckRock’s Uncounted project), I think this could be possible, though it’d likely be very hard to identify direct relationships between Long COVID and specific deaths. As far as I know, no researchers are working on this question; if you know of anyone who is, please reach out.
Still, the reader’s question got me thinking about how, exactly, we track the impacts of Long COVID. Doctors, researchers, and long-haulers themselves have learned a lot about the condition over the last three years. We still don’t have clear estimates of exactly how many people in the U.S. are dealing with this chronic disease, but we’ve come much closer to understanding its impacts than we were when patients first began advocating for themselves in 2020.
Tracking Long COVID is challenging because of uneven access to COVID-19 tests and to medical care, which means long-haulers with certain types of privilege are more likely to get an accurate diagnosis. A lack of knowledge about Long COVID, both among medical professionals and among the overall population of people who might get it, also contributes to this issue. (For more details, see this post from early December.)
Still, some strategies have emerged for identifying people with Long COVID and tracking how the condition is impacting them. Here are a few.
Following people who were hospitalized for COVID-19:
In this strategy, researchers identify people who had COVID-19 and track how the virus impacts them over time. It’s often easiest for researchers to track people who were hospitalized, since hospitals keep detailed medical records of their patients, though this tactic leaves out long-haulers who initially had mild cases.
Sometimes, researchers doing this type of follow-up study will directly survey COVID-19 patients, which can lead to more comprehensive data than using health records alone. One recent study in this category found that, among a group of 800 adults hospitalized for COVID-19, about half were still experiencing some financial issues and limitations in their ability to do day-to-day activities six months later. The study’s authors noted that financial issues were “reported more frequently” among patients who identified with demographic minorities.
Following COVID-positive patients through electronic health records:
Angela Vázquez, president of the Long COVID group Body Politic, summarized the two new studies succinctly on Twitter, writing: “Black and Hispanic Americans appear to experience more symptoms and health problems related to #LongCovid than white people, but are not as likely to be diagnosed with the condition.” Vázquez also pointed out that the studies may have missed neurological symptoms among Black and Hispanic patients, due to less access to care for these groups.
Black and Hispanic Americans appear to experience more symptoms and health problems related to #LongCovid than white people, but are not as likely to be diagnosed with the condition, according to new research funded by the National Institutes of Health.https://t.co/IUjyfdzqIZ
Electronic health records are far from perfect sources of Long COVID data, as they often present only sets of information that doctors are already compiling—and they are often biased towards the people who are able to access medical care for COVID-19 (or Long COVID) in the first place. As a result, some researchers track Long COVID through broader surveys, seeking to identify everyone who might have some long-term symptoms following a COVID-19 case, even if those people might not be calling their condition “Long COVID.”
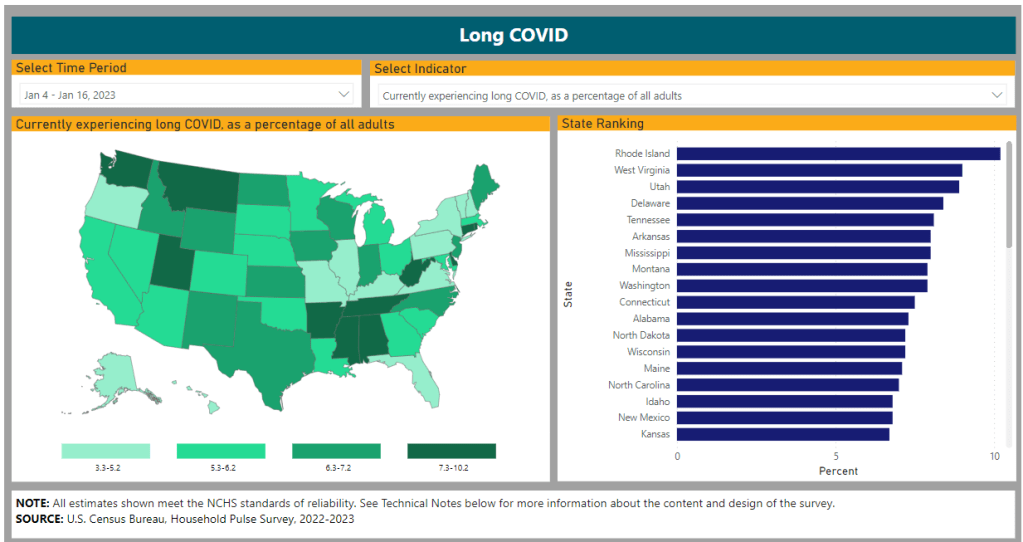
The Census and CDC’s Household Pulse Survey questions on Long COVID are one notable example of this strategy. Census researchers ask a random sample of Americans whether they’ve had “any symptoms lasting 3 months or longer” following a COVID-19 case, then follow up with questions about whether those symptoms are current and whether they impact the respondent’s ability to carry out day-to-day activities. The resulting data provide a broader view of Long COVID in the U.S., including people who may not have sought medical care for their symptoms.
Biological studies of specific organs impacted by COVID-19:
In order to better understand how a case of COVID-19 may lead to long-term, debilitating symptoms, some researchers focus on studying exactly what happens to different parts of the body after a coronavirus infection. This research sometimes focuses on testing for the continued presence of virus after a patient’s acute COVID-19 case is over or tracking changes to the immune system, as scientists test different theories into how Long COVID occurs.
One major area of research has been the brain. Freelance journalist Stephani Sutherland recently published a major feature in Scientific American exploring how Long COVID impacts the brain and nervous system, summarizing research into the biological causes of common symptoms like fatigue and brain fog. Physician E. Wesley Ely, who cares for Long COVID patients, wrote an essay on the same topic that appeared in STAT News this week; Ely discussed what he’s learned from autopsy studies examining the brains of people who had COVID-19.
Identifying trends in the labor market:
Finally, researchers often seek to track the impacts of Long COVID indirectly, by looking at statistics on people who have left the labor market during recent years. It’s no secret that a lot of people have left their jobs during the pandemic; Long COVID experts argue that the chronic disease may be one major driver of the labor shortage. One often-cited Brookings Institution analysis suggested two to four million people may be out of work due to Long COVID.
This strategy for studying Long COVID may be the most difficult, as it’s hard to actually tie job loss numbers to the condition without more specific data. Most research surveys or electronic health records databases don’t ask people about their work situations; the recent study cited above is a notable outlier. Similarly, most unemployment claims and short-term disability datasets don’t ask people if Long COVID is contributing to their need for assistance.
Still, I hope to see more studies in the future that examine Long COVID’s impact on work and other activities. Related: the U.S. Department of Labor recently published a report about the need for more assistance geared toward workers with Long COVID.
You might have seen some headlines like this in the last few weeks: COVID-19 was “mild” this winter. This winter was “better” than previous winters. COVID-19 is becoming “another seasonal virus” like flu and RSV. But is this true?
While it’s accurate that the U.S. reported fewer COVID-19 cases this past winter compared to last year (when the country experienced our first, massive Omicron surge) or the prior year (our biggest surge pre-vaccines), this winter still saw an extraordinary amount of severe illness, death, and potential future disability due to COVID-19. Surges of other respiratory viruses also put enormous strain on the healthcare system.
If we call this winter “mild,” we run the risk of believing this level of disease is acceptable. Such portrayals of COVID-19 seek to make us think future surges will be nothing to worry about, despite clear evidence to the contrary.
Let’s go through some numbers. Since the beginning of November, the U.S. has reported:
More than 5 million new COVID-19 cases (reported). Note that cases are likely underreported by 10 to 20 times in our era of under-testing, so the true number may be closer to 100 million.
More than 400,000 new COVID-19 hospitalizations, piling on top of hospitalizations for the flu, RSV, and other diseases, and coming as hospitals deal with staff shortages and worker burnout.
More than 40,000 new COVID-19 deaths, amounting to more than 400 new deaths per day. This number is also likely an undercount, as death certificates can take a long time to be processed.
The majority of COVID-19 deaths were among vaccinated people. A report from the Kaiser Family Foundation found that breakthrough deaths started to outnumber those among unvaccinated people in summer 2022, a trend that has continued with low booster uptake.
Coronavirus levels in wastewater were higher than all surges prior to Omicron, including the winter surge in 2020-2021 and the Delta surge in summer 2021, according to data from Biobot.
XBB.1.5, the latest and most contagious Omicron subvariant, evolved in the U.S. this winter, likely in New York State. Unchecked COVID-19 spread makes it easier for the virus to keep mutating.
More than 5% of American adults are currently experiencing Long COVID. This number has ranged from 5.5% to 7% since September 2022, according to the CDC and Census’ Household Pulse Survey.
Almost 80% of adults with Long COVID report activity limitations due to the condition, including about 25% who report “significant” activity limitations, per the Household Pulse Survey.
In an average week this winter, the U.S. reported more deaths from COVID-19 than the number of casualties on September 11, 2001. The latter event was a horrific tragedy that inspired lasting changes to national security, while the former has been written off as “mild.”
Past surveys from many sources—including the CDC itself—have suggested that, when people know COVID-19 is spreading widely in their communities, they’re willing to take basic safety precautions. But when government leaders and mainstream media outlets downplay the risks, people don’t have the information they need to make informed choices. We’ve seen this pattern at a large scale this winter, and I worry that the trend will only continue.
And here’s what concerns me even more: in previous winters, cases went up over the holidays, then declined through January and February. This year, however, the decline isn’t really happening. Transmission has gone down a bit from its peak, but it’s now plateaued at a level higher than the peaks of previous surges, per Biobot’s data.
So, not only did we have a bad surge this winter, we’re now stuck at a high-COVID baseline that seems very difficult to shake, in the era of many new variants and few public health precautions. The situation reminds me of a Twitter thread from the evolutionary biologist T. Ryan Gregory, which I shared when writing about XBB.1.5 in early January:
That said, I don't think "not as bad as the first Omicron wave" should be the standard. As noted, Canada, the UK, etc. had their deadliest year in 2022 through multiple Omicron waves. BA.1 was the highest peak, but the area under the curve of the others was as bad or worse. pic.twitter.com/5JwU857oHo
That “area under the curve” is what the U.S. is seeing now, as COVID-19 spread stays at high levels. Thousands of cases a day, thousands of hospitalizations a day, hundreds of deaths a day.
As a journalist and as an individual capable of taking precautions, I resist the narrative that any of this is acceptable. If you’re reading this, I hope you can, too.
This past Monday, the White House announced that the federal public health emergency for COVID-19 will end in May. While this decision might be an accurate reflection of how most of the U.S. is treating COVID-19 right now, it has massive implications for Americans’ access to tests, treatments, vaccines—and data.
Outside of a public health emergency, the CDC has limited authority to collect data from state and local health agencies. And even during the emergency, the CDC’s authority has been minimal enough that national datasets for some key COVID-19 metrics (like breakthrough cases and wastewater surveillance) have been very spotty.
When the federal emergency ends, the Department of Health and Human Services (HHS) may lose its ability to require reporting of some key data, including: PCR test results (from states), hospital capacity information and COVID-19 patient numbers (from individual hospitals), COVID-19 cases and deaths in nursing homes.
It’s possible that the HHS and/or CDC will negotiate new data reporting requirements with states and other entities that don’t rely on the public health emergency. They have about three months to do this. I haven’t seen much news on that yet, but I’ll keep an eye out and share updates as I find them.
Regardless, I expect that reporting COVID-19 numbers to federal data systems will become even more voluntary than it already is for health agencies, hospitals, congregate facilities, and other settings. We will likely have to rely more on targeted surveillance systems (which compile data from a subset of healthcare facilities) rather than comprehensive national datasets, similar to our current surveillance systems for the flu and other endemic diseases.
At the same time, the public health emergency’s end will lead to changes in the distribution of vaccines, tests, and treatments. The Kaiser Family Foundation has a helpful explanation of exactly what’s changing. Here are the highlights:
Vaccines will remain free to all as long as the stockpile of doses purchased by the federal government lasts. However, the ending emergency will likely impact the government’s ability to buy more vaccines—including future boosters that might be targeted to new variants. Vaccine manufacturers are planning to raise their prices, and cost will become a burden for uninsured and underinsured people.
At-home, rapid tests will no longer be covered by traditional Medicare, while Medicare Advantage coverage will vary by plan. Most private insurance providers will likely still cover the tests, but prices may go up (similarly to the prices for vaccines).
PCR tests are also likely no longer going to be covered by a lot of insurance plans and/or are going to get more expensive. Notably, Medicaid will continue covering both at-home and PCR tests through September 2024.
Treatments (primarily Paxlovid right now) will remain free for doses purchased by the federal government, similar to the situation with vaccines. After the federally-purchased supply runs out, however, we will similarly see rising costs and dwindling access.
In short, the end of the public health emergency will make it harder for Americans to get tested, receive treatments, and stay up to date with COVID-19 vaccines. The testing access changes, in particular, will lead to official case numbers becoming even less accurate, as fewer people seek out tests. At the same time, Americans will lose access to the data we need to know how much of a threat COVID-19 presents in the first place.
It’s also worth noting that, on the same day the White House announced the end of its emergency declaration, the World Health Organization announced the opposite: the global public health emergency is continuing, though it may end later in 2023. As Americans largely ignore COVID-19, millions of people around the world are unvaccinated, facing new surges, dealing with new variants, etc.
COVID-19 clearly remains a looming threat at the global level. In the U.S., we technically have the best vaccines and treatments to deal with the disease—but these tools are going underutilized, and the Biden administration’s decision this week will only make it harder for people to get them. Maybe we shouldn’t have to rely on an emergency declaration to get basic data and access to health measures in the first place.
New York State expands wastewater surveillance program: This week, the New York State health department announced a major investment in the state’s wastewater surveillance program: the program has received a $6.6 million grant from the CDC and $15 million from the governor (over the next three years). With this investment, New York’s wastewater surveillance network will grow from 125 to 215 testing sites and will expand from COVID-19 to include flu, RSV, hepatitis, norovirus, and antimicrobial resistance. This is great news for New York—I hope to see other states make similar investments.
Bivalent boosters vs. XBB lineages: The bivalent, Omicron-specific booster shots provide some protection against XBB.1.5 and related Omicron subvariants, according to a new study published this week in the CDC’s Morbidity and Mortality Weekly Report. CDC researchers used data from COVID-19 testing at pharmacies to compare results among people who had received the new booster and those who hadn’t. Booster recipients were significantly less likely to have a symptomatic XBB/XBB.1.5 infection compared to people who hadn’t received the shot, the researchers found (with a vaccine effectiveness value of 48%). While the boosters work less well against XBB.1.5 than they did against BA.4/BA.5, they’re still a valuable protective measure.
CDC overhauling data communications: The CDC is creating new internal offices that will change how it processes, publishes, and communicates about data, according to POLITICO. The new offices include an Office of Health Equity and an Office of Public Health Data, Surveillance, and Technology—both of which have new acting directors as of this week. It’s currently unclear what the new offices will do, exactly, or how they will improve upon a fractured nationwide health data system (with decisions about how to store and share key data largely left up to state agencies and private companies). Still, it’s good to see movement on the CDC’s efforts.
WHO deliberates ending the global health emergency: On Friday, a World Health Organization committee met to discuss whether the official global health emergency over COVID-19 should be ended. The committee’s decision will be made public tomorrow, as a recommendation to WHO Director-General Tedros Adhanom Ghebreyesus; Tedros will ultimately decide whether or not to end the emergency. Global health experts who spoke to STAT reporter Helen Branswell suggested that the WHO likely isn’t ready to end this emergency yet, but it may happen later in 2023.
KFF compiles Long COVID data: A new report from the Kaiser Family Foundation compiles and provides context for Long COVID data reported by the Census and CDC’s Household Pulse Survey. The share of people who reported ever having Long COVID symptoms following a COVID-19 case has declined slightly over time, the KFF report finds; this number went from 35% in June 2022 to 28% in January 2023. However, the number is still high and Long COVID can be debilitating for many, as 79% of people with Long COVID report limitations to their day-to-day activities.
Health of Congressional Districts: Finally: a new dashboard, published this week by researchers at NYU Langone Health, provides detailed health metrics for all 435 Congressional districts in the U.S. (plus Washington, D.C.). The dashboard is a helpful source for researchers and policymakers looking to understand health patterns in specific districts. One of its key metrics is a “COVID Local Risk Index” that reflects the risk residents face for severe health, social, and economic outcomes of COVID-19.
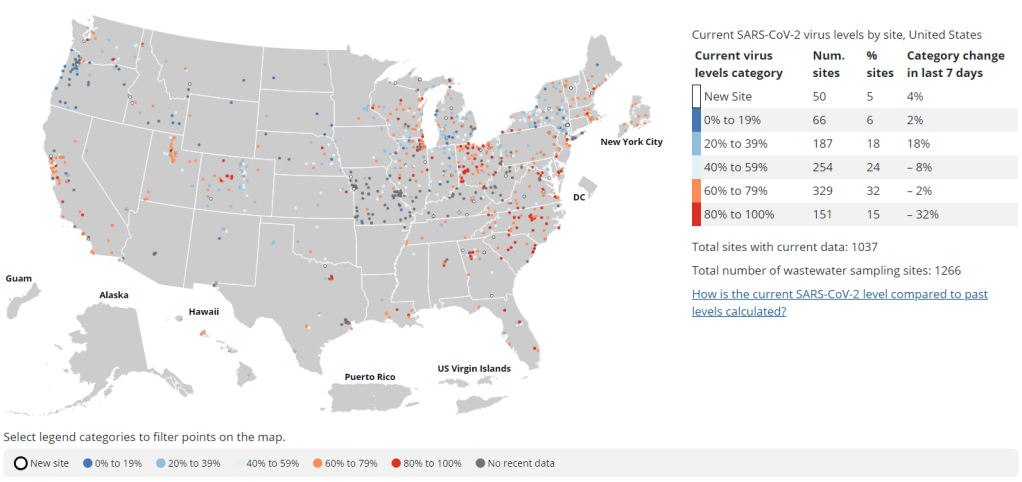
Nearly a year after the CDC’s National Wastewater Surveillance System began reporting public data, the system still has very unequal representation across the U.S.
This week, the National Academies of Sciences, Engineering, and Medicine (NASEM) released a major report about the state of wastewater surveillance for infectious diseases in the U.S. The report, written by a committee of top experts (and peer-reviewed before its release), is an extensive description of the promise and the challenges of wastewater testing.
Its authors describe how a grassroots network of researchers, public officials, and wastewater treatment plant staff developed strategies for sewage testing, analysis, and communicating results. Now, as committee chair Guy Hughes Palmer writes in the report’s introduction, broader collaboration and resources are needed to “solidify this emergency response to the COVID-19 pandemic into a national system” that continues to monitor COVID-19 as well as other public health threats. To this end, the report includes specific recommendations for the CDC’s National Wastewater Surveillance System.
Here are some key findings from the report, taken from its summary section and a NASEM webinar presentation last Thursday:
Overall, the report finds that wastewater surveillance data “are useful for informing public health action and that wastewater surveillance is worthy of further development and continued investment.” The authors recommend that public agencies at all levels keep funding and promoting this monitoring tool.
Wastewater surveillance is not a new technology; it’s been used for decades to monitor the spread of polio. But COVID-19 led to widespread adoption of this technology and innovation into how it could be used, driven by some municipalities and universities that were early to embrace wastewater.
As a population-level tool, wastewater surveillance provides data on how diseases spread through a community without relying on access to clinical testing. This surveillance is becoming more important for COVID-19 as people opt for at-home tests over PCR tests, and should be used specifically to track new variants.
Community sewersheds that may be tested range in size from serving hundreds of people to serving millions; they also differ based on geography, demographics, and many other factors. As a result, early researchers in this space developed testing and analysis methods that were specific to their communities.
Now, however, the CDC faces a challenge: “to unify sampling design, analytical methods, and data interpretation to create a truly representative national system while maintaining continued innovation.” In other words, standardize the system while allowing local communities to keep doing what works best for them.
Sites in the CDC’s National Wastewater Surveillance System (NWSS) are currently not representative of the U.S. as a whole, as the system is based on wastewater utilities and public health agencies choosing to participate.
The CDC needs to expand this system to be more equitable across the country, with targeted outreach, offering resources to sites not currently participating, and other similar tactics. This expansion process should be open and transparent, the report’s authors write.
As NWSS expands, the CDC should select and prioritize “sentinel sites” that can help detect new coronavirus variants and other new emerging health threats early on. These sites might include international airports as well as zoos and livestock farms, where potential animal-to-human transmission may be monitored.
Better public communication is needed: the CDC (and other agencies) should improve its public outreach about wastewater data, including addressing any privacy concerns that people may have. The report specifically recommends that the CDC “convene an ethics advisory committee” to assist with privacy concerns and data-sharing concerns.
In assessing potential new targets for wastewater surveillance, the report recommends three criteria: “(1) public health significance of the threat, (2) analytical feasibility for wastewater surveillance, and (3) usefulness of community-level wastewater surveillance data to inform public health action.”
NWSS needs more funding from the federal government to expand its sites, continue its COVID-19 tracking efforts, fund projects at state and local levels, and pivot to new public health threats as needed. This funding needs to be “predictable and sustained,” the report’s authors write.