Two quick updates about the CDC’s surveillance efforts for COVID-19 and other diseases:
The CDC has provided a short-term wastewater surveillance contract to Verily, the biotech company that’s affiliated with Google, so that data collection can continue at about 400 sewage testing sites while a longer-term contract is in dispute. This temporary measure will help keep up surveillance during the winter respiratory virus season, though Verily still has a lot of logistical work ahead to actually start testing at sites where another company, Biobot Analytics, was previously in charge. (Verily will need to contact the sites, send them equipment, set up sample collection procedures, etc.) The CDC’s National Wastewater Surveillance System is also working on an updated COVID-19 dashboard, according to POLITICO’s story about the short-term contract. For more context, see my coverage of the contract switch and POLITICO’s previous reporting.
The CDC is expanding its testing program for international travelers arriving at U.S. airports, in a three-month pilot program for the winter virus season. This program, called the Traveler-Based Genomic Surveillance program, has screened travelers for coronavirus variants over the last two years, primarily using PCR tests among travelers who volunteer for a nasal swab. This winter’s pilot program expands surveillance in two ways: adding about 30 testing targets (including flu, RSV, other common diseases, and markers of antimicrobial resistance), and adding wastewater testing at three airports. One airport, San Francisco’s international airport, was already providing samples from plane sewage. See my article in Science News for more details.
Last week, I shared an update about the Healthcare Infection Control Practices Advisory Committee (HICPAC), a group of advisors to the CDC that has been working on updated guidelines for limiting infectious disease spread in healthcare settings. The committee has faced criticism for failing to incorporate lessons from COVID-19 into its guidance, as well as for a lack of transparency in its operations.
The transparency issues continued this week, according to a press release by National Nurses United (NNU), a nurses union that’s been at the forefront of advocacy for better infection control guidelines. HICPAC only released a draft of its updated guidance on November 2, the day before it voted on the document. And it’s only giving the American public five days to review the document and provide feedback through public comments.
“HICPAC’s draft is permissive and weak and seeks not just to maintain existing practice — which has been shown to be inadequately protective — but even rolls back the use of some important measures, such as airborne infection isolation rooms,” said NNU president Zenei Triunfo-Cortez in a statement.
Despite calls to delay a vote on this document until hearing from healthcare workers and public health experts, HICPAC voted unanimously to finalize the guidance draft during its meeting this week. The vote indicates a lack of public transparency and a lack of consideration for relevant health expertise—which is troubling considering how influential this guidance is for setting standards in healthcare centers across the country.
For more details about HICPAC and instructions on making public comments, see this CDC webpage.
A couple of months ago, I wrote about the Healthcare Infection Control Practices Advisory Committee (HICPAC), a group of experts that’s been working on updating CDC guidance for infectious disease safety measures in healthcare settings. The committee’s work has come under scrutiny for failing to actually improve safety with lessons learned from COVID-19.
As outside health experts and advocates push HICPAC to consider improving mask standards, ventilation, and related guidance in healthcare settings, one group has led the advocacy effort: National Nurses United (NNU). This group is the largest nurses union in the U.S., with nearly 225,000 members and a lot of professional experience supporting better healthcare safety.
NNU’s organizing efforts around the HICPAC guidance have included a number of letters and petitions to the CDC, organizing speakers at the public comment sections of HICPAC meetings, and pushing for greater transparency around how the committee makes decisions. The nurses’ organization recently released documents summarizing meetings of HICPAC committee members working on the new infection control guidance, which it received through public records requests. The documents show how this group “has prioritized employer costs and profits over robust protections for health care workers and patients,” NNU says.
I’m writing about NNU’s efforts again now because HICPAC has another public meeting coming up this week, on November 2 and 3. If you’re interested in advocating for the committee to prioritize safety for workers and patients—not costs and profits—you can register to make a comment at the meeting. You can also sign onto a NNU petition asking the CDC to release the draft of HICPAC’s updated safety guidance.
Two weeks ago I wrote an article explaining that the CDC has a new wastewater contract, essentially transferring responsibility for COVID-19 testing at hundreds of wastewater treatment plants across the country from Biobot Analytics to a company called Verily, which is affiliated with Google. In the time since that post, I have seen some other articles and social media posts alleging that, thanks to the contract change, Biobot will no longer be posting any COVID-19 data on their dashboard. This is inaccurate!
It is true that Biobot no longer has access to data from about 400 sites that were part of the CDC contract. But Biobot still has its own testing network separate from the CDC’s—which actually predated its contract with the agency—and which includes hundreds of other sites across the country that either have individual contracts with Biobot or are receiving free testing in exchange for sharing data.
Copying from my post two weeks ago: on Biobot’s dashboard, “County-level data won’t change. National and regional data will still be available, but are likely to be less comprehensive pictures of wastewater trends across the U.S., if I’m right about Biobot no longer including CDC contract sites in those visualizations.” In fact, Biobot updated its dashboard this past Friday and will resume weekly updates soon, after making some changes to its data processing systems, according to social media posts from the company.
Meanwhile, it is currently unclear how the new contract will impact data on the CDC’s wastewater dashboard as well as on Verily’s own dashboard. On the CDC dashboard, you can see that contract sites are not reporting wastewater data while they switch testing providers. Verily has a dashboard that currently shows data from WastewaterSCAN, a separate program that already uses Verily to test its samples; this dashboard hasn’t added CDC sites yet as far as I know.
I’m not sharing the inaccurate posts I mentioned to avoid giving them extra attention, but I wanted to provide this extra update in case any readers had seen those posts and were confused. Once again: Biobot is still sharing data, it’s just less comprehensive, and I would still recommend going to their dashboard for COVID-19 trends. In this era of fragmented surveillance, it’s always good to rely on multiple dashboards (eg. CDC, Biobot, WastewaterSCAN) rather than just one.
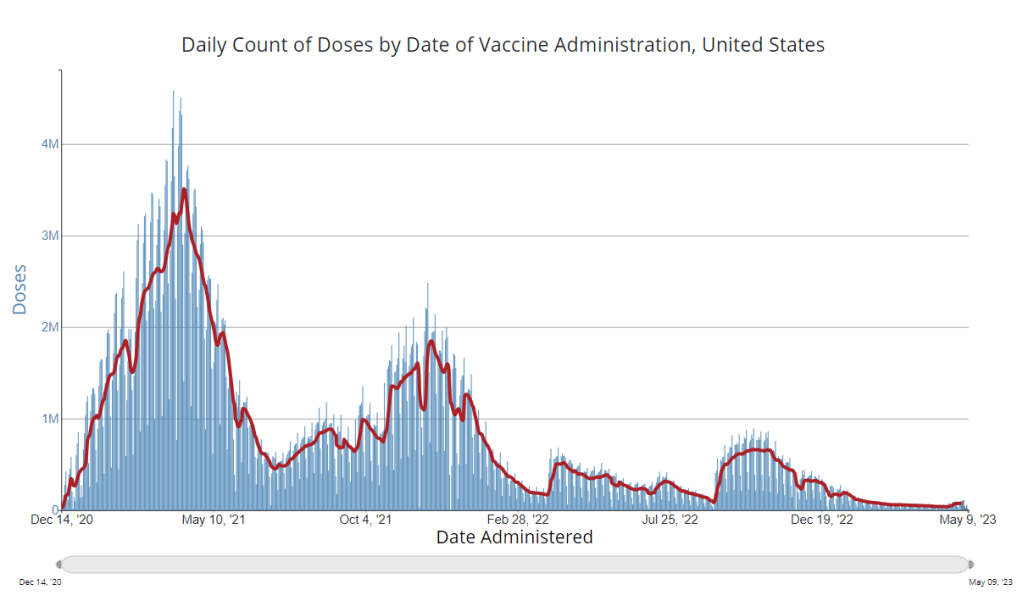
It’s now been a couple of weeks since updated COVID-19 vaccines became available in the U.S. At this point in prior COVID-19 vaccine rollouts, we would know a lot about who had received those vaccines: data would be available by state, for different age groups, and other demographic categories.
This time, though, the data are missing on a national scale. Following the end of the federal public health emergency in May, the CDC has lost its authority to collect vaccination data from all state and local health agencies that keep immunization records. As a result, the CDC is no longer providing comprehensive vaccination numbers on its COVID-19 dashboards.
But we still have some information about this year’s vaccination campaign, thanks to continued CDC efforts as well as reporting by other health agencies and research organizations. In fact, last week, the federal Department of Health and Human Services (HHS) told reporters that more than seven million Americans have received updated COVID-19 vaccines so far this fall.
HHS also said that about 14 million doses have been shipped to vaccination sites, primarily pharmacies. In addition, 710,000 vaccines for children have been ordered through a federal program that provides these shots.
Vaccine distribution numbers are slightly easier for the CDC and HHS to collect, as they can work directly with vaccine manufacturers. To understand how many people are getting the shots, though, is more challenging—requiring a mix of data from state and local agencies, surveys, and other surveillance mechanisms.
What changed with the PHE’s end:
Early in the pandemic, the CDC established data-sharing agreements with the health agencies that keep immunization records. This includes all states, territories, and a few large cities (such as New York City and Philadelphia) that have separate records systems from their states; you can see a full list of records systems here.
Through those agreements, the CDC collected vaccine administration numbers, standardized the data (as much as possible), and reported them on public dashboards. The CDC wasn’t able to collect as detailed demographic information as many health experts would’ve liked—for example, they never reported vaccinations by race and ethnicity below the national level. But the data were still useful for tracking who got vaccinated across the U.S.
These data-sharing agreements concluded with the end of the public health emergency (PHE) in May 2023. According to a CDC report published at that time, the CDC was able to extend agreements with some jurisdictions past the PHE’s end. Still, the report’s authors acknowledged that “future data might not be as complete” as during the emergency period. Even if 40 out of 50 states keep reporting, the remaining 10 represent data gaps.
Notably, the May report also claims that the CDC would continue to provide data on COVID-19 vaccination coverage on the CDC’s COVID-19 dashboard and a separate vaccination dashboard. But neither of those dashboards has been updated with any information from this fall’s vaccine campaign, as of this publication.
In addition to compiling data from state and local systems, the CDC has other mechanisms for tracking vaccinations. According to CBS News reporter Alexander Tin, CDC officials highlighted a couple during a briefing on October 4:
The National Immunization Survey, a phone survey conducted by CDC officials to estimate national vaccination coverage based on a representative sample of Americans. This survey is currently the CDC’s method for tracking flu vaccinations.
CDC’s Bridge Access and Vaccines for Children (VFC) programs, both of which buy vaccines to distribute to Americans who may not have health insurance or face other financial barriers to vaccination. The Bridge Access program was specifically set up for COVID-19 vaccines, while the VFC program covers other childhood vaccines.
Contact with vaccine manufacturers and distributors, i.e. the pharmaceutical companies that make the vaccines and the pharmacies and healthcare organizations that give them out. These companies share data with the CDC, offering insights into how many vaccines have been distributed to different locations; though the data may not be comprehensive if not all distributors are included (i.e. just big pharmacy chains, not smaller, independent stores).
Other places to look for vaccination data:
Outside of the CDC, there are a few other places where you can look for vaccination data. Here are a couple that I’m monitoring:
State and local public health agencies: Some agencies that track immunizations have their own dashboards, reporting on vaccinations in a specific state or locality. For example, New York City’s health department tracks COVID-19 vaccinations among city residents, although the agency hasn’t yet published data for this fall’s vaccines. I have a list of state vaccination dashboards here; this doesn’t currently represent data on the fall 2023 vaccines, but I aim to do that update in the coming weeks.
Outside surveys, such as KFF’s COVID-19 Vaccine Monitor: Like the CDC’s National Immunization Survey, other health organizations conduct surveys to track vaccinations. The Kaiser Family Foundation’s COVID-19 Vaccine Monitor is one well-known project, which has been doing regular surveys on COVID-19 vaccine uptake since December 2020.
Scientific reports answering specific vaccination questions: Public health researchers may use surveys, immunization records, or other data systems to study specific questions about vaccination, such as the impact that vaccination has on lowering a patient’s risk of severe disease. These studies are often published in the CDC’s Morbidity and Mortality Weekly Reportand other journals.
If you have other questions about vaccination data—or want to share a data source I didn’t mention here—please reach out: email me or leave a comment below.
During the most recent week of data available (October 1-7), the U.S. reported about 16,800 new COVID-19 patients admitted to hospitals, according to the CDC. This amounts to:
An average of 2,400 new admissions each day
5.1 total admissions for every 100,000 Americans
8% fewer new admissions than the prior week (September 24-30)
Additionally, the U.S. reported:
10.1% of tests in the CDC’s surveillance network came back positive
24% of new cases are caused by Omicron EG.5, 20% by XBB.1.6, 20% by HV.1, 14% by FL.1.5.1 (as of October 14)
COVID-19 data signals point to a continued lull in transmission across the U.S., ahead of likely increases as the weather gets colder. The Northeast is still reporting higher COVID-19 levels than other regions, according to wastewater and test positivity data.
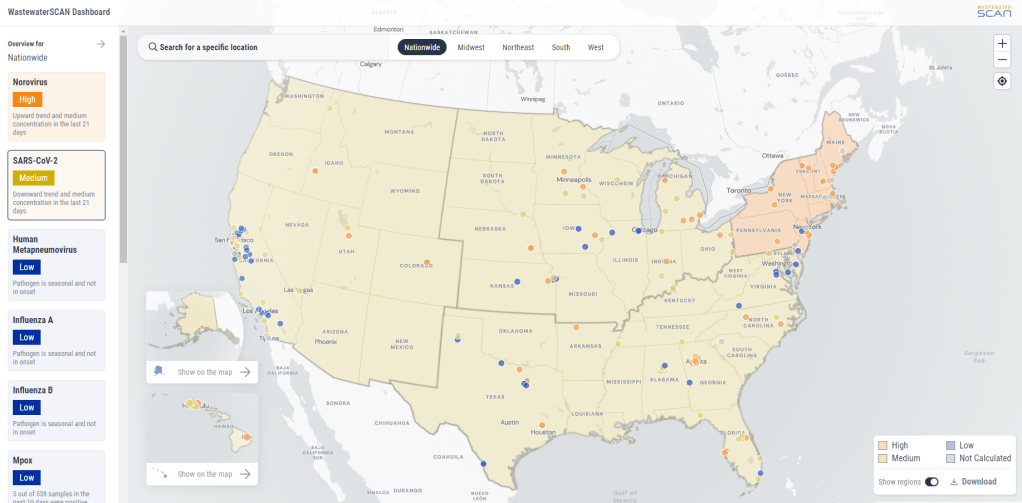
National wastewater surveillance patterns suggest that coronavirus spread is trending slightly downward, according to WastewaterSCAN’s dashboard. Viral levels are high in the Northeast and medium in the other major regions, per WastewaterSCAN’s metrics, with sites in Massachusetts, New York, Vermont, New Hampshire, and Maine reporting upticks.
Wastewater data from Boston and New York City similarly show recent coronavirus increases. As I noted last week, these Northeast cities are frequently the first sites of late fall/winter surges, as colder temperatures contribute to more indoor gatherings.
Biobot Analytics, typically one of my main sources of wastewater data, hasn’t updated its COVID-19 dashboard since October 2. The company is currently “making some improvements to [its] data infrastructure,” leading to less frequent updates at this time, a representative from Biobot wrote on Twitter last week. Data updates are planned on October 20 and November 3.
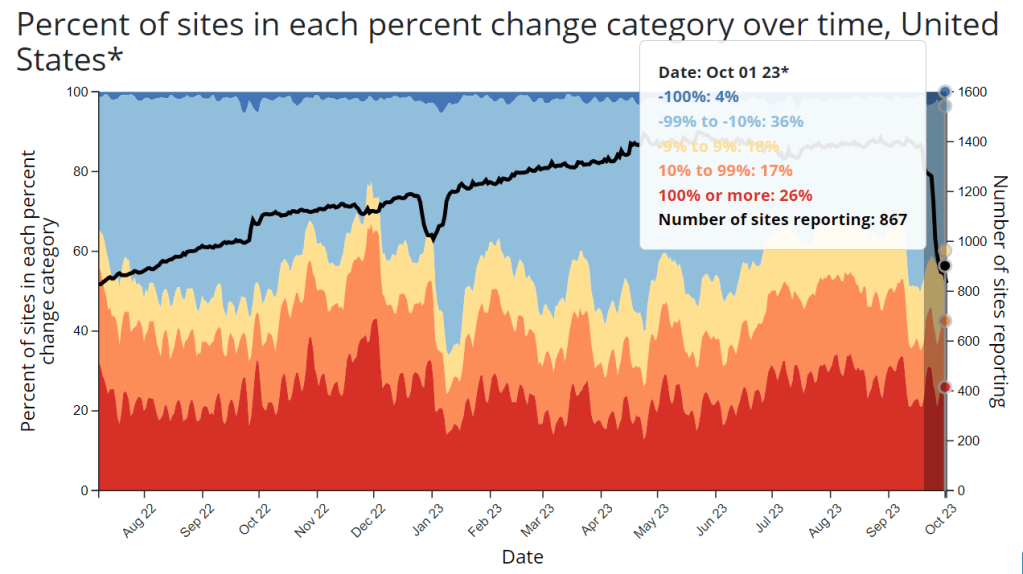
Biobot’s data infrastructure updates might be related to the CDC contract change (which I covered last week), though the Twitter post didn’t mention this specifically. The CDC’s wastewater dashboard, while missing updates from a couple hundred sites as they switch contractors, also shows higher COVID-19 spread in the Northeast.
The CDC’s test positivity data similarly report a continued lull at the national level: about 10% of tests in the agency’s lab testing network reported positive results in the week ending October 7, compared to a high of 15% in late August. Test positivity, like wastewater data, suggests higher spread in New England states and New York/New Jersey, as well as in some Midwest states, compared to other regions.
Variant surveillance by the CDC suggests that most cases in the U.S. are still caused by a variety of XBB.1.5 relatives: EG.5, HV.1, XBB.1.6, etc. This is a good time to get one of the updated COVID-19 vaccines, which are designed to target XBB.1.5, if you haven’t already. BA.2.86, a variant of interest that emerged a few weeks ago, hasn’t shown up in major numbers yet, but is beginning to appear in the CDC’s data and may drive more spread later in the fall.
Flu season has officially started, as of this week. Influenza-like illness (i.e. numbers of patients who go to their doctors’ offices with respiratory symptoms) is currently at lower levels than it was at this time last year, but is starting to “creep up,” Dr. Katelyn Jetelina wrote in a recent newsletter. Last year’s respiratory virus season “hit early and hard,” she said; we’ll see what happens this year.
Editor’s note, October 15: This article has been updated with comments from Verily.
This week, the CDC and life sciences company Verily announced that the agency awarded a five-year wastewater surveillance contract to Verily. The announcement marks a shift in the U.S. sewage monitoring landscape and will impact our public COVID-19 data, with short-term gaps and changing coverage in a couple of sources—but ultimate improvements in the long term.
First, some background:
In fall 2020, the CDC launched the National Wastewater Surveillance System (NWSS), a network of sewage testing sites around the country all reporting data to a central location. While some state and local health agencies quickly developed in-house systems for testing wastewater and reporting their data to NWSS, others lacked the resources (staff, lab capacity, data infrastructure, etc.) to start doing this new type of health surveillance.
As a result, the CDC began working with private testing companies to fill gaps in the NWSS network and expand surveillance more quickly across the country. The first contactor was a diagnostic company headquartered in Canada called LuminUltra. Then, last spring, the CDC awarded a contract to Biobot Analytics, a startup focused on wastewater surveillance. Biobot did a lot of work to extend the NWSS, helping bring the total CDC network up to nearly 1,400 sites; but the contractor switch initially led to a few weeks of missing data for about 150 sites covered by the CDC contract, as they transitioned from one set of testing protocols to another. (See my coverage at the time for more details.)
One advantage of Biobot working with the NWSS, if you’re someone who cares about public wastewater data, is that the company added data from many CDC contract sites to its COVID-19 wastewater dashboard, making that dashboard more comprehensive in its view of national COVID-19 patterns. You couldn’t view the CDC sites in Biobot’s county-level visualizations; those present data from other sites that have individual contracts with the company or are participating in the free Biobot Network program. But Biobot added CDC sites that opted into data-sharing to its national and regional visualizations, a company spokesperson told me last year.
What’s changing with the new contract:
Biobot’s contract with the CDC ended last month. The CDC’s new contract with Verily replaces it. Verily’s contract covers five years (as opposed to shorter periods for prior CDC wastewater testing contracts), and includes additions of more pathogens that may be tested through NWSS, in addition to SARS-CoV-2. These are both great improvements, adding to the surveillance system’s longevity and expanding its capacity beyond COVID-19—though additional federal funds will likely be needed past this contract.
However, in the short term, we will see data gaps on NWSS as contracted sites change over to Verily from Biobot. These testing sites may have to adjust how they collect samples, how they package and ship samples, and other logistical changes. The CDC NWSS dashboard already indicates a reporting dip in the last couple of weeks, coinciding with the contract change.
Meanwhile, Biobot will no longer have the same direct access to the CDC contract testing sites. While all the sites’ data will still be published publicly by the CDC, the Biobot-Verily switch will likely lead to changes in sample processing and analysis that make data from those sites no longer directly comparable with the hundreds of other sites covered by Biobot. My guess here is that Biobot may no longer be able to include the CDC contract sites in its national and regional visualizations.
I reached out to Biobot for comment about this shift, and haven’t heard back from them yet. I’ve also reached out to Verily asking about the contract changeover and any data-sharing plans they may have, and haven’t heard back there yet either. I will update this post with more details from the companies as I receive them.
How this new contract may impact major data sources:
CDC NWSS: Data from all sites participating in NWSS will continue to be available on the CDC’s dashboard, though the sites covered by the CDC’s national testing contract (previously with Biobot, now with Verily) may have missing data for a couple of weeks. NWSS continues to be the most comprehensive place to find wastewater data in the U.S., but unfortunately doesn’t share national or regional trends because it is compiling from many different testing programs with different methodologies.
Biobot Analytics: County-level data won’t change. National and regional data will still be available, but are likely to be less comprehensive pictures of wastewater trends across the U.S., if I’m right about Biobot no longer including CDC contract sites in those visualizations. Also worth noting, Biobot shifted its update schedule recently to once a week on Mondays (with a longer delay in data, but likely less retroactive updating).
WastewaterSCAN: No changes due to this contract switch, though WastewaterSCAN has been working with Verily for a while to test sewage samples from its network. This project also recently announced that it’s adding six more disease targets to its program: parainfluenza, rotavirus, adenovirus group F, enterovirus D68, Candida auris, and hepatitis A. See the statement from WastewaterSCAN below for more details.
In the long-term: The CDC’s new five-year contract will enable continued expansion of the NWSS, potentially with both more sites and more disease targets. I also expect public data offerings will continue to improve as scientists and public health officials learn more about how to interpret wastewater surveillance data.
Statement from WastewaterSCAN about the new contract
WastewaterSCAN was pleased to learn that the CDC selected Verily to support the National Wastewater Surveillance System (NWSS). As our lab partner, Verily has an important role managing sample collection logistics from wastewater treatment plants participating in the WastewaterSCAN network, processing samples, and supporting our research to advance the science of wastewater-based epidemiology.
WastewaterSCAN continues to demonstrate that wastewater monitoring can provide comprehensive, efficient, community-wide tracking of seasonal and emerging diseases. We recently added six disease targets to our program and are helping many communities prepare for the respiratory virus season with a public data dashboard to communicate what wastewater is telling us about the diseases circulating in our communities.
At this time, only data from our program will appear on WastewaterSCAN’s data dashboard. WastewaterSCAN will continue to make our methods public and to collaborate and share data with NWSS and contribute to its important, mission-critical work.
Statement from Verily, responding to COVID-19 Data Dispatch questions
CDD: Will the WastewaterSCAN dashboard start including data from wastewater testing sites included in the CDC contract, as they come online? Or is Verily planning to launch its own dashboard that will share data from those sites (perhaps in aggregate, national trends, similar to the current Biobot dashboard)?
Verily: WastewaterSCAN representatives have responded. On the question of sharing aggregated, national trends data from these sites: This is a CDC decision for the NWSS testing program.
CDD: Besides public dashboards, will there be alignment between WastewaterSCAN and Verily in how wastewater data are processed, analyzed, and interpreted?
Verily: There are many methods for analyzing the concentration of pathogens in wastewater. Verily offers several methods for wastewater analysis to its customers and ones chosen by the CDC NWSS and WastewaterSCAN programs differ primarily in what part of the wastewater is analyzed and how the pathogens are concentrated and extracted before measurement of pathogen concentrations. Beyond these initial steps, Verily’s lab processes all samples similarly.
The liquid fraction (of influent samples) will be concentrated and tested for the CDC NWSS program, similar to the approach previously used for NWSS contract testing.
The solid fraction of samples (from the primary clarifier or influent) has been shown to concentrate many pathogens and is tested for the WastewaterSCAN program.
Results from methods have shown agreement with case data in the literature. However, differences between the methods make them complementary to each other.
CDD: When the CDC previously switched contractors in spring 2022, some testing sites covered by the contract didn’t report to NWSS for several weeks while they transferred to a new process. What is Verily doing to help transition sites during the current switch?
Verily: Verily has an established system and team dedicated to onboarding new sites with the ability to rapidly initiate testing. This is informed by our previous experience providing logistics and lab services to over 200 sites in wastewater monitoring programs.
As we receive information from the CDC NWSS program about which sites will transition, we will get sites up and running as soon as possible. Our goal is to have up to 200 sites testing within the first four weeks of the contract.
CDC publishes Long COVID data from national survey: Every year, the CDC conducts the National Health Interview Survey, a detailed look at population health in the U.S. through interviews of about 30,000 adults and 9,000 children. In 2022, the survey included questions about Long COVID, defining the condition as symptoms for at least three months after an initial COVID-19 case. This week, the CDC published data from the 2022 survey. Among the findings: about 6.9% of adults had ever experienced Long COVID, and 3.4% had it at the time of their interview. These figures were 1.3% and 0.5% for children, respectively. Women were more likely to experience it than men, and the survey identified other demographic differences (race, income, etc.). While many of the findings align with other Long COVID data, this CDC survey is unique in providing data on Long COVID in kids—which can be devastating for the small (yet significant) number of people impacted.
Molnupiravir could lead to new coronavirus mutations: A new study, posted in Nature this week ahead of its final publication, identifies potential dangers of using the antiviral molnupiravir. (Molnupiravir, made by Merck, is a similar drug to Paxlovid but tends to be less effective, so it’s not used as widely.) For this study, researchers at the University of Cambridge, Imperial College London, and colleagues examined coronavirus sequence data and found that certain mutations were likely to increase after molnupiravir use. Researchers have already known that this antiviral could lead to more viral evolution, but the paper provides more details on specific mutation risks; further research may examine the drug’s implications for immunocompromised patients.
Accessibility issues for COVID-19 websites: Many state and territorial COVID-19 websites don’t meet accessibility guidelines, making their key health information difficult for people who are blind or visually impaired to access, according to researchers at North Carolina State University. The researchers recently replicated a study that they’d first done in 2021, running checks on state sites against standard web accessibility guidance. “In 2021, none of these public-facing COVID-19 sites met all the checked WCAG guidelines, and things did not get any better in 2023,” study author Dylan Hewitt said in a statement. Issues include incompatibility with screen readers, limited color contrast, and no alt text for images.
Polling data indicate higher interest in flu shots than COVID-19shots: The Kaiser Family Foundation (KFF) has published a new round of polling data from its COVID-19 Vaccine Monitor, focusing on vaccinations this fall. About 58% of adults in the poll said they would get a flu shot this year, compared to 47% who said they would get an updated COVID-19 shot. Vaccine interest continues to be partisan, the poll suggested, with Democrats much more likely to express confidence in the updated COVID-19 vaccines’ safety than Republicans. Democrats were also more likely to respond to increased COVID-19 spread, with 58% of those polled saying they recently took more precautions in response to the surge this summer.
New behavioral health survey data from the CDC: One more CDC update from this week: the agency has just published 2022 data from its Behavioral Risk Factor Surveillance System (BRFSS). The BRFSS involves interviews of more than 400,000 adults each year, including questions about alcohol use, tobacco use, immunizations, cancer screenings, mental health, and more. While the data aren’t directly related to COVID-19, this surveillance system may be a valuable source for reporters or researchers seeking contextual data about health behaviors in a particular state, city, or county.
As fall begins, we’re approaching respiratory virus season—that time of year when viruses like the flu, RSV, common coronaviruses, and adenoviruses all spread readily throughout the Northern Hemisphere. Tracking systems for these viruses may also be helpful for following COVID-19 this fall and winter.
While COVID-19 doesn’t yet follow a predictable, seasonal pattern, its activity has increased with these other viruses in the last couple of years. (Indoor gatherings and travel, particularly around the holidays, lead to outbreaks of all kinds.)
This year, experts anticipate COVID-19 will spread with the colder weather again. But we have fewer systems tracking it than we did during earlier pandemic winters: no more case data, testing and hospitalization data aren’t as comprehensive or reliable, death data are significantly delayed (and more likely than ever to undercount true COVID-19 deaths), etc.
So, people seeking to keep up with disease trends in their areas might find it helpful to look at surveillance sources that include COVID-19 along with other respiratory diseases. The CDC’s FluView dashboard is one major source, presenting data from clinical testing laboratories and healthcare settings that participate in the agency’s regular surveillance programs.
Despite the name, FluView includes data on all viruses that cause cold and flu symptoms, including COVID-19. (In fact, the same lab network that informs this dashboard is also the current source of the CDC’s COVID-19 test positivity data.) FluView is a helpful place to see overall respiratory disease activity for the U.S. as a whole and for particular states and regions. I find the state-by-state map of influenza-like activity particularly useful.
Tracking COVID-19 during fall and winter 2023 is going to be harder than it’s been during prior years. But we aren’t entirely in the dark. The CDC’s respiratory virus surveillance programs are one helpful source to look at, along with wastewater surveillance and the other COVID-specific programs that remain active.
Free at-home tests from the federal government: The Department of Health and Human Services (HHS) and U.S. Postal Service are restarting their program offering free COVID-19 rapid, at-home tests. Starting tomorrow, every U.S. household will be able to order four more tests at covidtests.gov. HHS also announced that it’s buying about 200 million further rapid tests from major manufacturers, paying a total of $600 million to twelve companies. Of course, four tests per household is pretty minimal when you consider all the exposures people are likely to have this fall and winter—but it’s still helpful to see the federal government acknowledge a continued need for testing.
New grants support Long COVID clinics: The HHS and Agency for Healthcare Research and Quality (AHRQ) also announced a new grant program for clinics focused on Long COVID, aiming to make care for this condition more broadly accessible to underserved communities. Nine clinics across the country have received $1 million each, with the opportunity to renew their grants over the next five years. (At least, that’s my interpretation of the HHS press release, which says $45 million in total is allocated to this program.) This is a pretty significant announcement, as it marks the first time that the federal government is specifically funding Long COVID care; funding has previously gone to RECOVER and other research projects.
CDC announces new disease modeling network: One more federal announcement: the CDC’s Center for Forecasting and Outbreak Analytics has established a new program to improve the country’s disease surveillance, working with research institutions across the country. The CDC has awarded $262.5 million of funding to the thirteen institutions participating in this program, which it’s calling the Outbreak Analytics and Disease Modeling Network. These institutions will develop new surveillance tools, test them in small-scale projects, and scale up the successful options to broader public health systems. For more context on the CDC’s forecasting center, see my story for FiveThirtyEight last year.
Testing wildlife for COVID-19: Speaking of surveillance: researchers at universities and public agencies are collaborating on new projects aiming to better understand how COVID-19 is spreading and evolving among wild animals. One project, at Purdue University, is focused on developing a test to better detect SARS-CoV-2 among wild animals. A second project, at Penn State University, is focused on increased monitoring, with plans to test 58 different wildlife species and identify sources of transmission from animals to humans. Both projects received grants from the U.S. Department of Agriculture and involve collaboration with state environmental agencies.
Paxlovid access falls along socioeconomic lines: A new study, published this week in JAMA Network Open, examines disparities in getting Paxlovid. Researchers at the National Institutes of Health analyzed public data on Paxlovid availability as of May 2023. Counties with higher poverty, less health insurance coverage, and other markers of high socioeconomic vulnerability had significantly less access to Paxlovid than better-off counties, the scientists found. Meanwhile, a separate study (also in JAMA Network Open last week) found that Paxlovid and another antiviral treatment, made by Merck, both remain very effective in reducing severe COVID-19 symptoms. Improving access to these treatments should be a top priority for the public health system.
Undercounted COVID-19 cases in Africa: One more study that caught my attention this week: researchers at York University in Canada developed a mathematical model to assess how many people actually got COVID-19 in 54 African countries during the first months of the pandemic. Overall, only 5% of cases in these countries were actually reported, the researchers found, with a range of reporting from 30% in Libya to under 1% in São Tomé and Príncipe. A majority of cases in these countries were asymptomatic, the models suggested, indicating many people may not have realized they were infected. The study shows “a clear need for improved reporting and surveillance systems” in African countries, the authors wrote.