Category: Wastewater

  • How one wastewater plant became a leading COVID-19 forecasting source

    How one wastewater plant became a leading COVID-19 forecasting source

    The Metro Plant in the Twin Cities, Minnesota metro area has been tracking COVID-19 in wastewater since 2020. Dashboard screenshot retrieved on April 24.

    This week, I had a new story published with FiveThirtyEight and the Documenting COVID-19 project about the data and implementation challenges of wastewater surveillance.

    COVID-19 levels in waste—or, from our poop—have become an increasingly popular data source in the last couple of months (in this newsletter and for many other reporters and commentators), as PCR testing sites close and at-home tests become the norm. Wastewater can provide us with early warnings of rising transmission, and it includes COVID-19 infections from people who can’t or don’t want to get a PCR test.

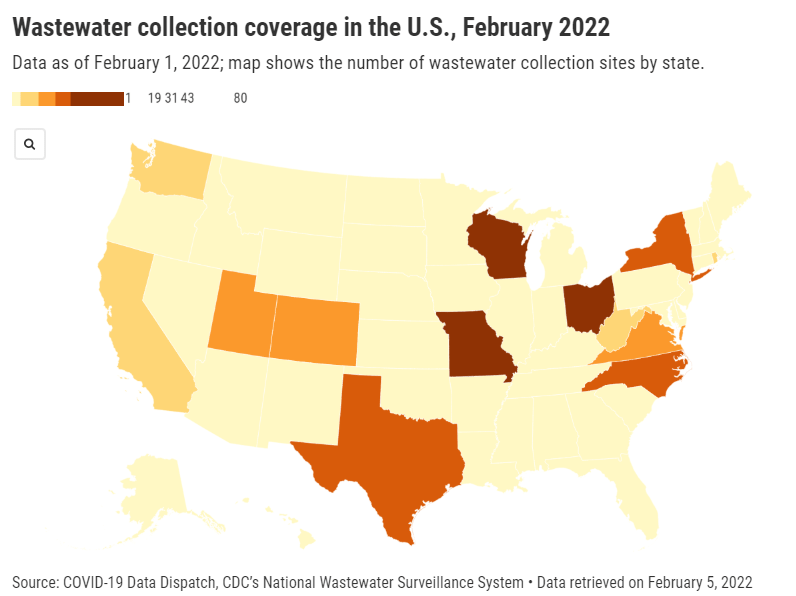
    But wastewater surveillance is very uneven across the country, as I’ve noted before. A lot of local health agencies, research groups, and utility companies are now trying to expand their COVID-19 monitoring in wastewater, but they face a lot of barriers. My reporting suggests that we are many months (and a lot of federal investment) out from having a national wastewater surveillance system that can actually replace case data as a reliable source for COVID-19 trends and a driver for public health action.

    For this story, I surveyed 19 state and local health agencies, as well as scientists who work on wastewater sampling. Here are some major challenges that I heard from them (pulled from an old draft of the story):

    • Wastewater surveillance is highly sensitive to changes in a community’s coronavirus transmission levels, particularly when those levels are low, as has been the case across the U.S. in recent weeks.
    • Every wastewater collection site is different, with unique environmental and demographic factors – such as weather patterns or popularity with tourists – that must be accounted for.
    • While the CDC has led some coordinated efforts through the National Wastewater Surveillance System (NWSS), wastewater sampling techniques overall aren’t standardized across the country, leading to major differences in data quality.
    • Sparsely populated, rural communities are particularly challenging to monitor, as their small sizes lead to even more heightened sensitivity in wastewater.
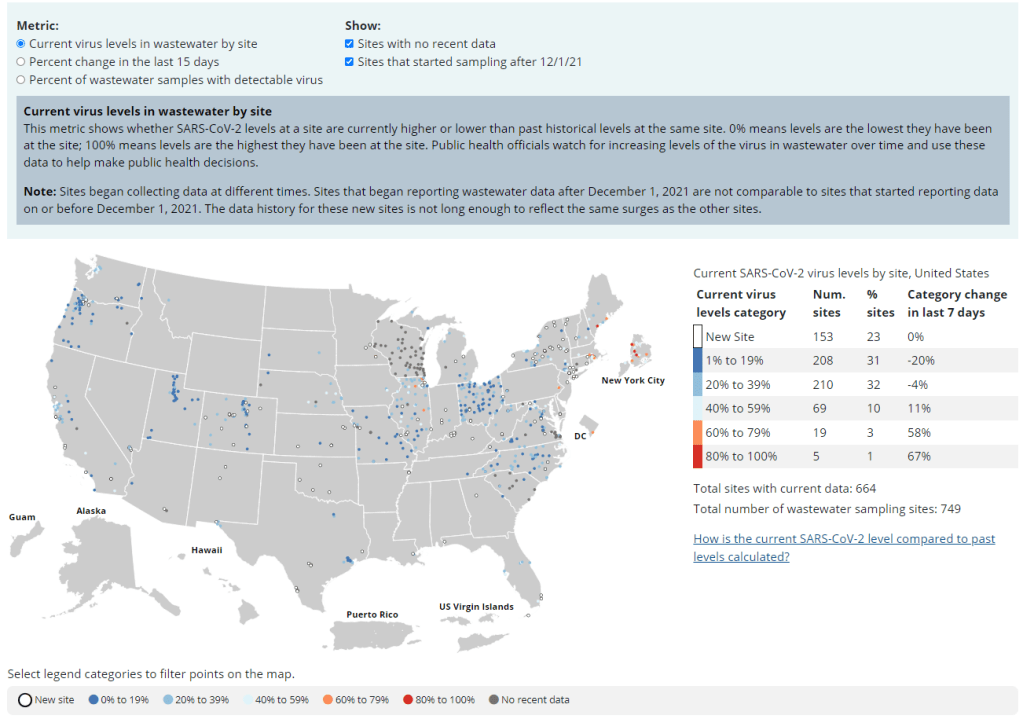
    • Wastewater data is hard to communicate, especially when public health officials themselves aren’t sure how to use it. The CDC’s NWSS dashboard is a prime example.

    As bonus material in today’s COVID-19 Data Dispatch, I wanted to share one of the interviews I did for the story, which provides a good case study of the benefits and challenges of COVID-19 surveillance in wastewater.

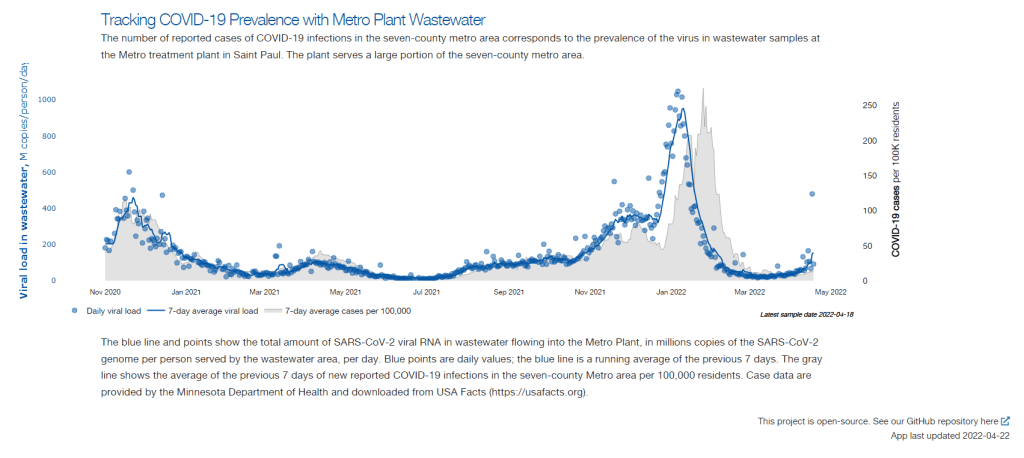
    In this interview, I talked to Steve Balogh, a research scientist at the Metropolitan Council, a local agency in the Twin Cities, Minnesota metro area that manages the public water utility (along with public transportation and other services). Balogh and his colleagues started monitoring Twin Cities’ wastewater for COVID-19 in 2020, working with a research lab at the University of Minnesota. 

    Balogh gave me a detailed description of his team’s process for analyzing wastewater samples. Our conversation also touches on the learning curve that it takes to set up this surveillance, the differences between monitoring in urban and rural areas, and the dynamics at play when a wastewater plant suddenly becomes an important source for public health information. Later in the interview, Bonnie Kollodge, public relations manager at the Metropolitan Council, chimed in later to discuss the wastewater data’s media reception.

    This interview has been lightly edited and condensed for clarity. Also, it’s worth noting that the interview was conducted in early April; since then, COVID-19 levels have started rising again in the Twin Cities metro area’s wastewater.


    Betsy Ladyzhets: The first thing I wanted to ask about was, the backstory of sampling at the Metro Plant. I saw the dashboard goes back to November 2020, and I was wondering if that’s when you got started, and how that happened?

    Steve Balogh: We actually started looking into it in April of 2020. And we contracted with Biobot at that time… But in May, their price went up, so we started looking for alternatives. Then, we started a partnership with people at the University of Minnesota Genomics Center, who know about measuring RNA in things.

    At that point, we tried to figure out how to extract the RNA from our samples. They [University of Minnesota researchers] didn’t know anything about wastewater, but they knew everything about RNA. We know all about wastewater, but we don’t know anything about RNA. So it was a good match.

    That summer, [the university researchers] started trying to do the extractions and it didn’t really work out so well… So we said, “Okay, we’re going to try this.” By September of 2020, we had built our own lab, and we were trying out our own extractions, based on what we were seeing in the literature, and all the preprints that were piling up. In October, basically we settled on [a sampling process] that worked. And by November 1, we were actually getting data.

    BL: Yeah, that definitely aligns with what I’ve heard from some of the other scientists I’ve talked to who have worked on this, where it’s like, everybody was figuring [wastewater sampling methods] out on their own back in 2020.

    SB: Yeah, it was on the fly. Papers were coming out daily, just about, with new ideas on how to do things. And we had, like, four different extraction methods that we wanted to look at, also looking at sludge, in addition to influent wastewater… Honestly, it was pretty much pure luck that we settled on [a method] that really, really worked.

    We tried to get daily samples, and to put up numbers and see what [the data] looked like. And it actually did work—it actually tracked the reported caseload quite well. We figured, well, it must be working. We also did QA [quality assurance] in the lab, spiking the samples with known amounts of RNA, and trying to get that back. And all of that came back really well, too. So, we have a lot of confidence in our method.

    BL: So that [QA] is like, you put in certain RNA, and then you check to make sure that it shows up in the sample?

    SB: Exactly, yeah.

    BL: What is your process for analyzing the samples and distinguishing those trends, like seeing how they match the case numbers?

    SB: We do the extractions at our lab, with the samples from the Metro Plant. We take three milliliters of wastewater and we add 1.5 milliliters of something called Zymo DNA/RNA Shield, from a company in California called Zymo. That’s a buffer that stabilizes the RNA—it basically explodes whatever virus particles are in there, breaks them up, and then it stabilizes the RNA in the sample. So you can actually store those samples at room temperature for days, or maybe even weeks, because the RNA is stabilized.

    Then, we put that treated sample through a two-step extraction process. The first step is, we put the whole thing into a Zymo III-P column, combined with 12 milliliters of pure ethanol, and run that through the column. This is a silica column, so the RNA in the sample binds to the silica. Then we wash it and elute that RNA in 200 microliters of water. And then we take that 200 microliters, and run it though the second stage, which is just a smaller silica column. The RNA that’s in that 200 microliters binds onto the smaller column, and then we wash it and elute that into 20 microliters.

    Our total concentration is going from three milliliters of wastewater down to 20 microliters of pure water. That’s a concentration factor of 150. We figured that would work for pretty much most situations, and it’s turned out to be true.

    Then, we store those samples at minus 80 degrees Celsius. Until we take them over weekly to the University of Minnesota, where they do droplet digital PCR, RT-PCR, to amplify and detect the RNA that’s in our samples. We started out just getting the total viral load back in November 2020. But then, in the early part of 2021 when Alpha showed up, we started doing variant analysis as well. We’re now also looking for specific mutations that distinguish the different variants of concern, like Alpha and Delta and Omicron.

    BL: So, you take the samples every day, but then you bring them over [to the university] once a week, is that correct?

    SB: That’s correct.

    BL: When you’re getting that data, coming from the U of MN lab, what are you doing to interpret it? Or, in communicating the data on your dashboard, what are the considerations there?

    SB: We work up the numbers and calculate a total load of the virus, or the particular variants, that’s coming into the plant. And then we basically put that up on the dashboard. There’s not a whole lot of interpretation or manipulation of the data—we’re simply importing the load, basically, of what we see coming into the plant. The load is the concentration that we’ve measured in the sample, times the total volume of wastewater coming into the plant. 

    We think that’s a sufficient normalization procedure for a large wastewater treatment plant. I know some groups are using other normalization techniques, but we think load is sufficient to tell us what’s happening out in our sewer shed.

    BL: Yeah, that makes sense. I know this gets more complicated when you have smaller sites, but your sewer shed is serving a big population—

    SB: Almost two million people. Yeah, it’s a big sewershed. If you had 50% of your population leaving during the day to go to work in the next community, that would be something that you might have to consider using other normalization techniques. But that just isn’t the case [in the Twin Cities]. We see a pretty steady signal here.

    BL: Makes sense. Have you considered expanding to other sites? Or are is the plan to just stick with sampling at the main sewer ship location?

    SB: We already have, actually. We operate nine different wastewater treatment plants in the seven-county metro area. And we’ve already expanded to three of those other sites, so we now have four total plants that we’re taking samples at and having them analyzed at the Genomic Center. It only started within the last month, so we don’t have quite the database to really start showing it on our dashboard yet. But when we do [have more data], our plan is to put that up [on the dashboard] as well.

    BL: Do you have a sense of how much time it might take before you feel the data is useful enough to put on the dashboard?

    SB: Part of the problem has been, all of these samples that we’re getting from these other plants, we’re just taking the entire sample over to the Genomics Center, and they’re doing the extractions. They’re using my extraction procedure, but they’re doing it in their lab. So, there was some learning curve for them to figure that out. And also to hire staff and come up to speed in terms of facility, and procedure, and people… Now, it’s been a few weeks, and I think they’re just about there [in getting a handle on the RNA extraction methods]. So, I think our data will start to shape up pretty quickly. 

    Another thing that may be keeping us, at this point, from showing the data is, nothing’s happening. We’re at this bottom [with low coronavirus levels in the wastewater] where everything just looks noisy, because nothing’s changing. But as soon as we start to go up, and if we get higher—the current position is just going to look like a flat line. But right now, people could look at it and say, “Well, that’s just junk.”

    So, in that sense, we just don’t want to confuse matters and say, “Here’s a bunch of junk for you to look at. We want to put it into some context. And the context really is, when things start taking off, then you see, “Oh, it used to be very low. And now it’s very high.”

    (Editor’s note: Since this interview was conducted in early April, COVID-19 levels have started rising in the Twin Cities metro area.)

    BL: That makes a lot of sense. Also, I hear you on the challenges of learning these methods. I was a biology major in school, and I worked in a lab, briefly, that did RNA extraction. And I remember how tricky it is, so I can envision the learning curve.

    SB: Well, these are experts at the Genomics Center, they know what they’re doing. But I think even they have been surprised at how how robust the viral RNA is in wastewater. A lot of people at the beginning of this pandemic said, “You’ll never see it in wastewater. It’s RNA, RNA is very sensitive, it’ll break down.” But that just isn’t the case—the RNA is quite robust in wastewater, and the signal lasts for a long time. It has to last for many hours, for it to travel from the far end of our sewershed to get to us [at the treatment plant]. And then, even in the refrigerator, when you refrigerate just the raw sample, it’ll stay in a reasonable concentration without dropping too much for days.

    BL: What has the reception to this work been from the public, the state health department, or from local media or other people who are using and watching the data?

    SB: It’s been incredible. You can ask Bonnie more about it.

    Bonnie Kollodge: It’s ginormous. I mean, it just has spread everywhere. I don’t even know the social spread, but I think somebody was tracking our impressions in print and online media… I think there were, like, 11 million impressions between January and the end of March. And we get lots of requests for Steve’s time, lots of requests for a daily accounting [of the data]. 

    When we began this work, it really was out of public service—seeing that there’s a pandemic going on, and what can we do to help? That’s when they started developing this idea, then working with the Depratment of Health, which is really our state lead on this [COVID-19 response]. They came to rely heavily on our information, to compare it against what their test results were showing. Then, as people started to do home testing, that was a whole other factor. It was really wastewater that was taking the lead on showing what was happening with the virus and the variants… 

    Every week, we put an update online, and reporters go right to it, to determine how they’re gonna position [their COVID-19 updates]. Steve also provides, in addition to the data, a little narrative about what’s happening that helps reporters—some who are very conversant in data, but others who are not—it helps them it understand what we’re seeing.

    BL: I can see how that would be helpful, especially if you’re releasing a week’s worth of data points at once. You sort-of have a mini trend to talk about.

    BK: Yeah, and we send it to the governor’s office, and to the Health Department. They appreciate the transparency… They know what’s happening [with the virus], and can adapt.

    BL: Right. And Bonnie, you mentioned something I wanted to ask more about, which is how the increased use of at-home tests and lower availability of PCR tests has increased the demand for wastewater data in the last few months, in particular. Now that you maybe have less reliable case data to compare against, has the thinking and interpreting the wastewater data shifted at all?

    SB: I think we’ve actually had that statement from reporters. They’ve said, “We can’t trust the testing data anymore. And it’s going to be wastewater from here on out.”

    BK: Just this week, there was a reporter who asked to get early results tomorrow. And he said, “This [wastewater data] is what I’m watching.” … The public has glommed on to this resource as a demonstration of what’s happening. And, like Steve said, it’s not a small sample. There are almost two million people served by this by this particular plant.

    BL: From what I understand, part of what can be really helpful [with wastewater data] is when you have that longevity of data, as you all do. You have a year and a half of trends. And so when you see a new spike, it’s easier to compare to past numbers than for other parts of the country that are just starting their wastewater surveillance right now.

    SB: Yeah. I think the other thing that has been really useful for our [state] department of health is, they’ve really appreciated the variant data that we have. That was really the first thing that got their attention… And we were giving them [variant] data ahead of time. The clinical tests were taking days or weeks to come back, and we could give them variant data the same week. So, that was the first thing that got our department of health here interested. But when they saw that we can track trends, they recognized that this has value at lower levels when testing goes away, basically.

    BL: How would you want to see support from the federal government in expanding this wastewater work? Like you mentioned, getting it in more treatment plants, and any other resources that you feel would be helpful.

    SB: Well, I think that’s underway, as we understand it, with the National Wastewater Surveillance System, NWSS. I think they’re funded through 2025, and I think the goal there is to basically sign up as many treatment plants as they can in the country.

    (Editor’s note: This is accurate, per a CDC media briefing in February.)

    Hopefully, that’s the beginning of something that is going to go beyond the pandemic, and give us a measure of community health in the future. Because wastewater is a community urine test, basically. It’s everybody contributing, and it can be useful for other pathogens and viruses in the future. So, yeah, [expanding that network] would be great. Let’s do it.

    BL: Do you envision adding other viruses to the testing that you’re doing? Flu or RSV are ones that I’ve heard some folks are considering.

    SB: Yeah, that would be something to do going forward for us. Though, it’s not clear how long we continue this work, just because these other projects are expanding, like the national project. And even our department of health here [in Minnesota] is talking about bringing this type of analysis into their own laboratory. Certainly going forward, long-term, that would be a goal for any work done here in Minnesota—to add those things to the menu of what we’re analyzing.

    BL: Right. So you might be taking the samples to the Minnesota health department instead of the university, or something like that?

    SB: Someday. Yeah, we just don’t know at this point.

    BK: This is an evolving scinece. And this is not what we typically do—I mean, we do wastewater collection and treatment. So this [COVID-19 reporting] is a little outside of our regular parameters. But, like Steve and his superiors have been saying, this is an evolving science, so let’s see where this takes us, in terms of infectious disease.

    It’s funny, when I go out and talk to people and say, “I work for the Met Council, and I help in communications with the wastewater analysis,” everybody knows what I’m talking about. It’s just so much out there. But I think that these things [testing for other diseases] are all being explored, and this has really opened up new possibilities.

    SB: From the beginning, it’s just been a scramble. You don’t know what’s going to be coming. What I’m doing, a lot, is trying to get ourselves in a position so that, when the next variant of concern pops up, we have an assay that can measure it. There’s still a lot of unknowns about what’s going on, and everything’s new every day, just about.


    More state data

  • COVID source shout-out: CDC wastewater dashboard upgrades

    COVID source shout-out: CDC wastewater dashboard upgrades

    The CDC’s updated wastewater dashboard includes more metrics and more context for people seeking to understand wastewater trends in their area.

    After the CDC released its National Wastewater Surveillance System (NWSS) dashboard in February, the agency faced some criticism from scientists, data reporters, and others who found this dashboard didn’t actually do a very good job of presenting wastewater data. The initial dashboard only included one metric, percent change in wastewater levels over the last 15 days; without more context, it was difficult to understand where a high percent change was actually cause for concern.

    But the CDC has responded to its criticism! This past Friday, the agency updated its wastewater dashboard to include a lot more context. Among the changes:

    • You can now toggle between three metrics: the old percent change value, along with current virus levels in a site’s wastewater and the share of wastewater samples at a given site that tested positive for the coronavirus in the last 15 days.
    • Clicking on a specific site provides users with a mini-chart of wastewater levels at that collection spot over the last few weeks.
    • The dashboard lets you toggle on and off sites with no recent data and sites that started sampling during the Omicron wave.
    • Above and below the dashboard, the CDC has added more definitions and explanations to help users understand what they’re looking at.

    On Friday evening, I posted on Twitter, asking wastewater and data viz experts to weigh in on the updated dashboard:

    Responses were mostly positive, with researchers saying that they were glad to see the CDC respond to criticism and add more information to the dashboard. Still, there’s more the agency can do, such as adding the population sizes covered by each site and, maybe, moving away from percentage changes as such a central metric.

    To quote Claire Duvallet, data scientist at Biobot: “I think collapsing all three metrics to have the same units, and to choose percentage as that unit, is very confusing. Percentage changes are already so 🤯 to think about, & percentage changes of categories of percentages is just too much for my brain.”

  • Pandemic preparedness: Improving our data surveillance and communication

    Pandemic preparedness: Improving our data surveillance and communication

    Screenshot of the new Biden COVID-19 plan.

    As COVID-19 safety measures are lifted and agencies move to an endemic view of the virus, I’m thinking about my shifting role as a COVID-19 reporter. To me, this beat is becoming less about reporting on specific hotspots or control measures and more about preparedness: what the U.S. learned from the last two years, and what lessons we can take forward—not just for the future COVID-19 surges that are almost certainly coming, but also for future infectious disease outbreaks.

    To that end, I was glad to see the Biden administration release a new COVID-19 plan focused on exactly this topic: preparedness for new surges, new variants, and new infectious diseases beyond this current pandemic.

    From the plan’s executive summary:

    Make no mistake, President Biden will not accept just “living with COVID” any more than we accept “living with” cancer, Alzheimer’s, or AIDS. We will continue our work to stop the spread of the virus, blunt its impact on those who get infected, and deploy new treatments to dramatically reduce the occurrence of severe COVID-19 disease and deaths.

    The Biden plan was released last week, in time with the president’s State of the Union address. I read through it this morning, looking for goals and actions connected to data collection and reporting.

    Here are a few items that stuck out to me, either things that the Biden administration is already doing or should be doing: 

    • Improving surveillance to identify new variants: The U.S. significantly improved its variant sequencing capacity in 2021, multiplying the number of cases sequenced by more than tenfold from the beginning to the end of the year. But the new Biden plan promises to take these improvements further, by adding more capacity for sequencing at state and local levels—and, crucially, “strengthening data infrastructure and interoperability so that more jurisdictions can link case surveillance and hospital data to vaccine data.” In plain language, that means: making it easier to track breakthrough cases (which I have argued is a key data problem in the U.S.).
    • Expanding wastewater surveillance: As I’ve written before, in the current national wastewater surveillance network, some states are very well-represented with over 50 collection sites; while other states are not included in the data at all. The Biden administration is committed to bring more local health agencies and research institutions into the surveillance network, thus expanding our national capacity to get early warnings about surges.
    • Standardizing state and local data systems: I’ve written numerous times that the U.S. suffers from a lack of standardization among its 50 different states and hundreds of local health agencies. According to the new plan, the Biden administration plans to facilitate data sharing, aggregating, and analyzing data across state and local agencies—including wastewater monitoring and other potential methods of surveillance that would provide early warnings of new surges. This would be huge if it actually happens.
    • Modernize the public health data infrastructure: One thing that could help health agencies better coordinate and share data: modernizing their data systems. That means phasing out fax machines and mail-in reports (which, yes, some health departments still use) and investing in new electronic health record technologies, while hiring public health workers who can manage such systems.
    • Use a new variant playbook to evaluate new virus strains: Also in the realm of variant preparedness, the Biden administration has developed a new “COVID-19 Variant Playbook” that may be used to quickly determine how a new variant impacts disease severity, transmissibility, vaccine effectiveness, and other factors. The new playbook may be used to quickly update vaccines, tests, and treatments if needed, by working in partnership with health systems and research institutions.
    • Collecting demographic data on vaccinations and treatments: The Biden plan boasts that, “Hispanic, Black, and Asian adults are now vaccinated at the same rates as White adults.” However, CDC data shows that this trend does not hold true for booster shots: eligible white Americans are more likely to be boosted than those in other racial and ethnic groups. The administration will need to continue collecting demographic data to identify and address gaps among vaccinations and treatments; indeed, the Biden plan discusses continued efforts to improve health equity data.
    • Tracking health outcomes for people in high-risk settings: Along with its health equity focus, the Biden plan discusses a need to better track and report on health outcomes in nursing homes, other long-term care facilities, and other congregate settings like correctional facilities and homeless shelters. Congregate facilities continue to be major COVID-19 hotspots whenever there’s a new outbreak, so improving health standards in these settings should be a major priority.
    • Studying and combatting vaccine misinformation, vaccine safety: The new plan acknowledges the impact of misinformation on vaccine uptake in the U.S., and commits the Biden administration to addressing this trend. This includes a Request for Information that will be issued by the Surgeon General’s office, asking researchers to share their work on misinformation. Meanwhile, the administration will also continue monitoring vaccine safety and reporting these data to the public.
    • Test to Treat: One widely publicized aspect of the Biden plan is an initiative called “Test to Treat,” which would allow people to get tested for COVID-19 at pharmacies, health clinics, long-term care facilities, and other locations—then, if they test positive, immediately receive treatment in the form of antiviral pills. If this initiative is widely funded and adopted, the Biden administration should require all participating health providers to share testing and treatment data. This would allow researchers to evaluate whether this testing and treatment rollout has been equitable across different parts of the country and minority groups.
    • Website for community risk levels and public health guidance: The Biden plan includes the launch of a government website “that allows Americans to easily find public health guidance based on the COVID-19 risk in their local area and access tools to protect themselves.” The CDC COVID-19 dashboard was recently redesigned to highlight the agency’s new Community Level guidance, which is likely connected to this goal. Still, the CDC dashboard leaves much to be desired when it comes to comprehensive information and accessibility, compared to other trackers.
    • A new logistics and operational hub at HHS: In the last two years, the Department of Health and Human Services (HHS) built up an office for coordinating the development, production, and delivery of COVID-19 vaccines and treatments. The new Biden plan announced that this office will become a permanent part of the agency, and may be used for future disease outbreaks. At the same time, the Biden administration has added at-home tests, antiviral pills, and masks to America’s national stockpile for future surges; and it is supporting investments in laboratory capacity for PCR testing.
    • Tracking Long COVID: Biden’s plan also highlights Long COVID, promoting the need for government efforts to “detect, prevent, and treat” this prolonged condition. The plan mentions NIH’s RECOVER initiative to study Long COVID, discusses funding new care centers for patients, and proposes a new National Research Action Plan on Long COVID that will bring together the HHS, VA, Department of Defense, and other agencies. Still, the plan doesn’t discuss actual, financial support for patients who have been out of work for up to two years.
    • Supporting health and well-being among healthcare workers: The new Biden plan acknowledges major burnout among healthcare workers, and proposes a new grant program to fund mental health resources, support groups, and other systems of combatting this issue. Surveying healthcare workers and developing systematic solutions to the challenges they face could be a major aspect of preparing for future disease outbreaks. The Biden plan also mentions investing in recruitment and pipeline programs to support diversity, equity, and inclusion among health workers.
    • More international collaboration: The new Biden plan also focuses on international aid—delivering vaccine donations to low-income nations—and collaboration—improving communication with the WHO and other global organizations that conduct disease surveillance. This improved communication may be especially key for identifying and studying new variants in a global pandemic surveillance system.

    This week, a group of experts—including some who have advised the Biden administration— followed up on the Biden plan with their own plan, called “A Roadmap for Living with COVID.” The Roadmap plan also emphasizes data collection and reporting, with a whole section on health data infrastructure; here, the authors emphasize establishing centralized public health data platforms, linking disparate data types, designing data infrastructure with a focus on health equity, and improving public access to data.

    Both the Biden administration’s plan and the Roadmap plan give me hope that U.S. experts and leaders are thinking seriously about preparedness. However, simply releasing a plan is only the first step to making meaningful changes in the U.S. healthcare system. Many aspects of the Biden plan involve funding from Congress… and Congress is pretty unwilling to invest in COVID-19 preparedness right now. Just this week, a $15 billion funding plan collapsed in the legislature after the Biden administration already made major concessions.

    Readers, I recommend calling your Congressional representatives and urging them to support COVID-19 preparedness funding. You can also look into similar measures in your state, city, or other locality. We need to improve our data in order to be prepared for future disease outbreaks, COVID-19 and beyond.

    More national data

  • The CDC is finally publishing wastewater data—but only ten states are well-represented

    The CDC is finally publishing wastewater data—but only ten states are well-represented

    This week, the CDC added wastewater tracking to its COVID-19 data dashboard. Wastewater has been an important COVID-tracking tool throughout the pandemic, but it gained more public interest in recent months as Omicron’s rapid spread showed the utility of this early warning system. While the CDC’s new wastewater tracker offers a decent picture of national COVID-19 trends, it’s basically useless for local data in the majority of states.

    Wastewater, as you might guess from the name, is water that returns to the public utility system after it’s been used for some everyday purpose: flushing a toilet, bathing, washing dishes, and so forth. In wastewater surveillance, scientists identify a collection point in the sewer system—either beneath a specific building or at a water treatment plant that handles sewage from a number of buildings. The scientists regularly collect wastewater samples from that designated point and test these samples for COVID-19 levels.

    When someone is infected with the coronavirus, they are likely to shed its genetic material in their waste. This genetic signal shows up in wastewater regardless of people’s symptoms, so a wastewater sample may return a positive result for the coronavirus earlier than other screening tools like rapid antigen tests. And, because wastewater samples are typically collected from public sewer networks, this type of surveillance provides information for an entire community—there’s no bias based on who’s able to get a PCR or rapid test.

    Scientists and organizations who utilize wastewater testing consider it an early warning system: trends in wastewater often precede trends in reported COVID-19 cases. For example, the coronavirus RNA levels identified in Boston’s wastewater shot up rapidly before Boston’s actual Omicron case numbers did, then also went down before case numbers did. Similarly, Missouri’s wastewater surveillance system—which includes genetic sequencing for variants—identified Delta cases last summer weeks before PCR testing did.

    Wastewater surveillance is also a popular strategy for colleges and universities, which can set up collecting sites directly underneath student dormitories. Barnard College, where I went to undergrad, is one school that’s employed this strategy. At one point in the fall 2021 semester, the college instructed students living in the Plimpton residence hall (where I lived as a sophomore!) to get individual PCR COVID-19 tests because the wastewater surveillance program had found signals of the virus under their dorm.

    Screenshot of the CDC’s new wastewater dashboard, retrieved on February 6.

    The CDC has been coordinating wastewater surveillance efforts since September 2020, Dr. Amy Kirby, team lead for the National Wastewater Surveillance System, said during a CDC media briefing on Friday. “What started as a grassroots effort by academic researchers and wastewater utilities has quickly become a nationwide surveillance system with more than 34,000 samples collected representing approximately 53 million Americans,” Kirby said.

    It’s a little unclear why it took the CDC so long to set up a dashboard with this wastewater data when surveillance efforts have been underway for a year and a half. Still, many researchers and reporters are glad to see the agency finally publishing this useful information. The dashboard represents wastewater collection sites as colored dots: blue dots indicate that coronavirus RNA levels have dropped at this site in the last two weeks; yellow, orange, and red dots indicate RNA levels have risen; and gray dots indicate no recent data. You can download data from a dropdown beneath the dashboard and on the CDC’s data portal site.

    “More than 400 testing sites around the country have already begun their wastewater surveillance efforts,” Kirby said at the media briefing. But she failed to mention that, out of these sites—the actual total is 471, according to the CDC dashboard—more than 200 are located in just three states: Missouri, Ohio, and Wisconsin. Missouri, with 80 sites, has a long-established system to monitor wastewater, through a collaboration between state agencies and the University of Missouri. Ohio has 71 sites of its own, while Wisconsin has 61.

    After these Midwest wastewater powerhouses, other states with a relatively high number of collection sites include North Carolina with 38, Texas with 35, New York with 32, Utah with 31, Virginia with 29, Colorado with 21, and California with 17. No other state has more than 10 wastewater collection sites, and 18 states do not have any wastewater collection sites at all.

    So, the CDC dashboard is pretty useful if you live in one of these ten states with a high number of collection sites. Otherwise, you just have to… wait for more sites in your area to get added to the dashboard, I guess? (Kirby did say during the media briefing that several hundred more collection sites are in development.) Even within the states that are doing a lot of wastewater surveillance, though, reporting is uneven at more local levels; for instance, many New York sites are concentrated in New York City and surrounding suburbs.

    In this way, biased wastewater surveillance coverage in the U.S. echoes biased genetic sequencing coverage, an issue I’ve written about many times before. (See the genetic surveillance section of this post, for example.) Some states, like California, New York, and others with high-tech laboratories set up for sequencing, have identified variants for a much higher share of their COVID-19 cases than states with fewer resources.

    The CDC gives wastewater treatment plants, local health departments, and research laboratories the ability to join its national surveillance network. But again, this is much easier for institutions in some places than others. Consider the resources available for wastewater sampling in New York City compared to in rural parts of the Midwest and South.

    In addition, for places that do have robust wastewater surveillance systems, there are some caveats to the data, the CDC expert told reporters. Data may be hard to interpret “in communities with minimal or no sewer infrastructure and in communities with transient populations, such as areas with high tourism,” she said. “Additionally, wastewater surveillance cannot be used to determine whether a community is free from infections.”

    If you’re looking for more wastewater data beyond the CDC tracker, here are two sources to check out:

    • Biobot’s Nationwide Wastewater Monitoring Network, which I included in last week’s Featured Sources: This wastewater epidemiology company collects samples from water treatment facilities across the country; their dashboard includes both estimates of coronavirus levels in the U.S. overall and estimates for specific counties in which data are collected. Biobot’s data are available for download on Github. (Interestingly, it seems that some of the counties included in Biobot’s dashboard are not currently included in the CDC’s dashboard; I’ll be curious to see if that changes in the coming weeks.)
    • COVIDPoops19 dashboard: This dashboard, run by researchers at the University of California Merced, provides a global summary of wastewater surveillance efforts. It includes over 3,300 wastewater collection sites tied to universities, public health agencies, and other institutions; click on individual sites to see links to dashboards, align with related news articles and scientific papers.

    More federal data