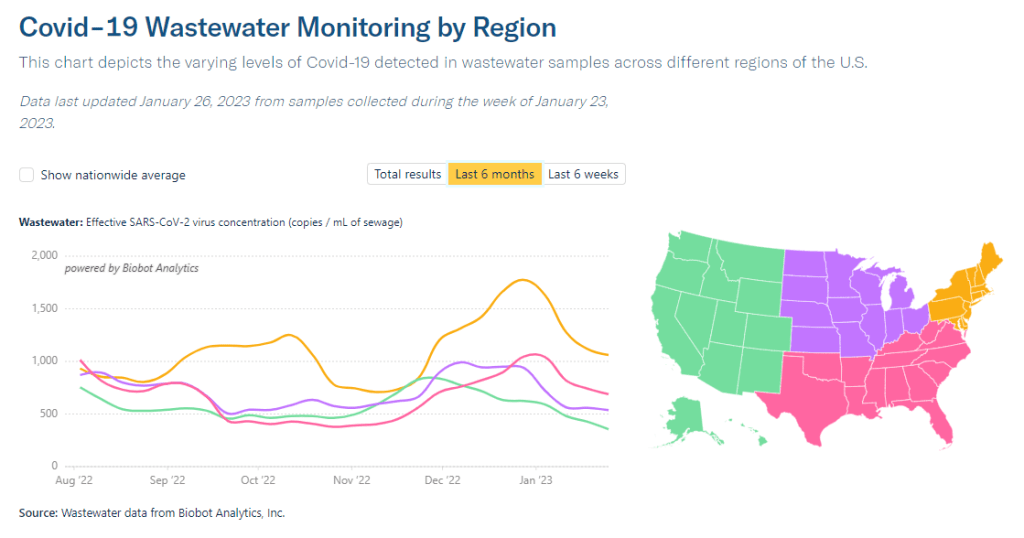
Biobot’s regional data suggest that most of the country is seeing declining COVID-19 spread, but we’re heading into high plateaus.
In the past week (January 19 through 25), the U.S. officially reported about 300,000 new COVID-19 cases, according to the CDC. This amounts to:
An average of 42,000 new cases each day
90 total new cases for every 100,000 Americans
11% fewer new cases than last week (January 12-18)
In the past week, the U.S. also reported about 30,000 new COVID-19 patients admitted to hospitals. This amounts to:
An average of 4,200 new admissions each day
9.0 total admissions for every 100,000 Americans
14% fewer new admissions than last week
Additionally, the U.S. reported:
3,800 new COVID-19 deaths (540 per day)
61% of new cases are caused by Omicron XBB.1.5; 31% by BQ.1 and BQ.1.1; 2% by CH.1.1 (as of January 28)
An average of 100,000 vaccinations per day
At the national level, COVID-19 spread appears to be approaching another plateau. New cases and hospitalizations (as reported by the CDC) are still in decline, but their descent is slowing: reported cases dropped by 11% this week, compared to 24% last week.
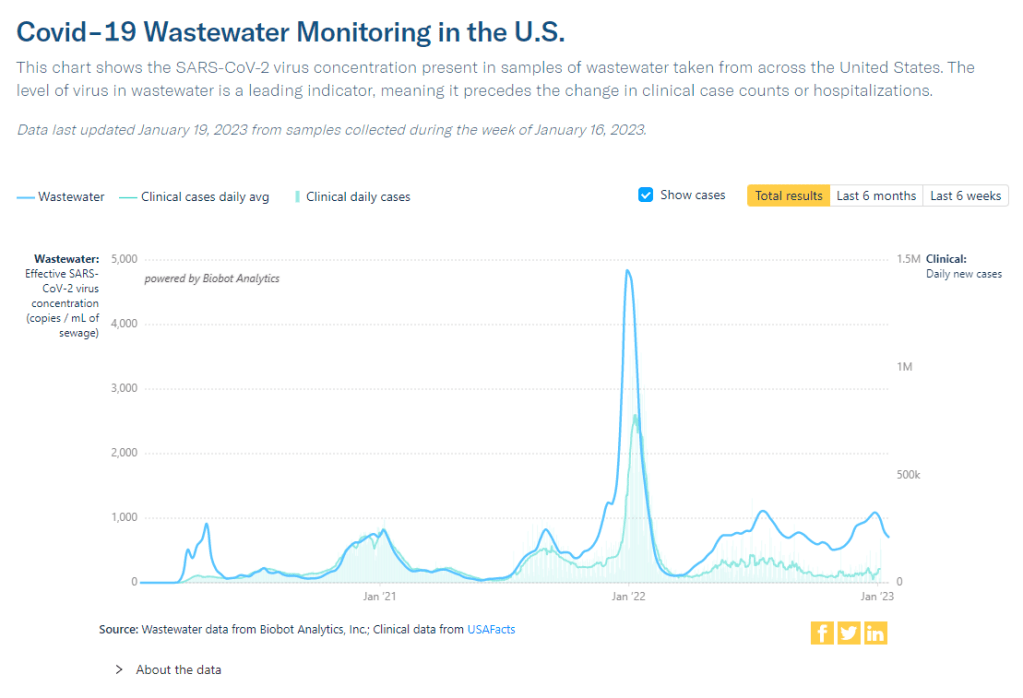
Wastewater surveillance presents the same trends. National data from Biobot suggest that COVID-19 transmission is leveling out in a similar place to where we were in October and November 2022, before the holiday surge drove up spread.
Biobot’s regional data show a slowing decline in the Northeast, plateaus in the Midwest and South, and a somewhat-more-pronounced decline in the West. And wastewater surveillance data from the CDC shows that COVID-19 spread is going up in some places, down in others: out of about 1,000 sites reporting data in the last two weeks, 48% reported decreases in coronavirus levels while 40% reported increases.
Unlike in recent weeks where every state has reported declines in COVID-19 cases and hospitalizations, a few places are now reporting definitive upticks, according to the latest Community Profile Report. These states include Alaska, Vermont, Maine, South Dakota, North Dakota, Nevada, Oklahoma, Minnesota, and Indiana.
Why might some states report COVID-19 upticks just after we emerged from a surge over the holidays? One explanation could be the XBB.1.5 variant, which continues to outcompete other Omicron lineages. XBB.1.5 now comprises about 60% of new cases nationwide (according to the CDC’s estimates); while it is most dominant in the Northeast, it’s growing—and likely reinfecting people—in other regions.
The CDC’s latest variant estimates also now include Omicron CH.1.1, which has been connected to rising cases in the U.K. and New Zealand in recent months. Per the CDC, CH.1.1 has been present in the U.S. at low levels (like, 1% or less) for a few weeks now, without posing a major challenge to XBB.1.5. But it is still a variant worth keeping an eye on.
As flu and RSV cases continue to trend down, the U.S. is confronted with the final weeks of a respiratory disease-heavy winter that was pretty rough on our healthcare system—but fell short of the mind-boggling case numbers that we saw in the prior two winters. Yes, we didn’t see a repeat of “the first Omicron wave”; but still, millions of people got sick, thousands died. Many will likely experience Long COVID as a consequence of their infections this winter.
In the past week (January 12 through 18), the U.S. officially reported about 330,000 new COVID-19 cases, according to the CDC. This amounts to:
An average of 47,000 new cases each day
101 total new cases for every 100,000 Americans
24% fewer new cases than last week (January 5-11)
In the past week, the U.S. also reported about 35,000 new COVID-19 patients admitted to hospitals. This amounts to:
An average of 5,000 new admissions each day
10.7 total admissions for every 100,000 Americans
16% fewer new admissions than last week
Additionally, the U.S. reported:
4,000 new COVID-19 deaths (560 per day)
49% of new cases are caused by Omicron XBB.1.5; 40% by BQ.1 and BQ.1.1 (as of January 21)
An average of 150,000 vaccinations per day (CDC link)
National COVID-19 metrics continue to suggest that the U.S. is coming out of its holiday surge, though some parts of the country may face increased transmission as the Omicron variant XBB.1.5 spreads.
Official COVID-19 case numbers and new hospital admissions both reported declines this week, according to the CDC (of 24% and 16% respectively, compared to the prior week). Biobot’s wastewater surveillance data also show a decline, with coronavirus concentration at a similar level to mid-November 2022, just before Thanksgiving.
This trend is fairly consistent across states and regions, according to case and hospitalization data from the latest HHS Community Profile Report. However, Biobot’s regional and county-level data suggest that COVID-19 spread is in a plateau or even starting to increase in some parts of the South and Midwest regions.
Hospitalizations for the flu and RSV are following a similar pattern to COVID-19, according to a new CDC dashboard that reports on all three illnesses together. Almost all states reported moderate or low levels of influenza-like activity in the week ending January 14, very different from the patterns we were seeing a few weeks ago. The only areas still reporting high influenza-like activity are California, North Dakota, New Mexico, Texas, Puerto Rico, New York City, and Washington D.C.
All of this is good news, suggesting that the worst of this winter’s respiratory virus surges may be behind us. But COVID-19 is still spreading across the country at fairly high levels, reflecting the high baseline that the U.S. has faced ever since new Omicron subvariants started to hit in spring 2022.
We also need to continue watching XBB.1.5, the latest and most contagious version of Omicron. This subvariant caused about half of new cases in the U.S. in the last week, according to CDC estimates. It’s most prevalent in the Northeast but is quickly gaining ground in the Southeast and other regions. (And the BQ lineages that currently dominate these regions can spread quickly, too.)
In the coming weeks, we’ll see how much XBB.1.5 (and any other variants) contribute to increased transmission in these regions. Meanwhile, COVID-19 deaths went up recently as the holiday surge took its toll: more than 500 people have died from COVID-19 every day in the last two weeks. Deaths are always the most delayed—and the most tragic—metric.
It’s the fourth year of the pandemic. I’ve written this statement in a few pitches and planning documents recently, and was struck by how it feels simultaneously unbelievable—wasn’t March 2020, like, yesterday?—and not believable enough—haven’t we been doing this pandemic thing for an eternity already?
As someone who’s been reporting on COVID-19 since the beginning, a new year is a good opportunity to parse out that feels-like-eternity. So this week, I reflected on the major trends and topics I hope to cover in 2023—both building on my work from prior years and taking it in new directions.
(Note: I actually planned to do this post last week, but then XBB.1.5 took higher priority. Hence its arrival two weeks into the new year.)
Expansions of wastewater, and other new forms of disease surveillance
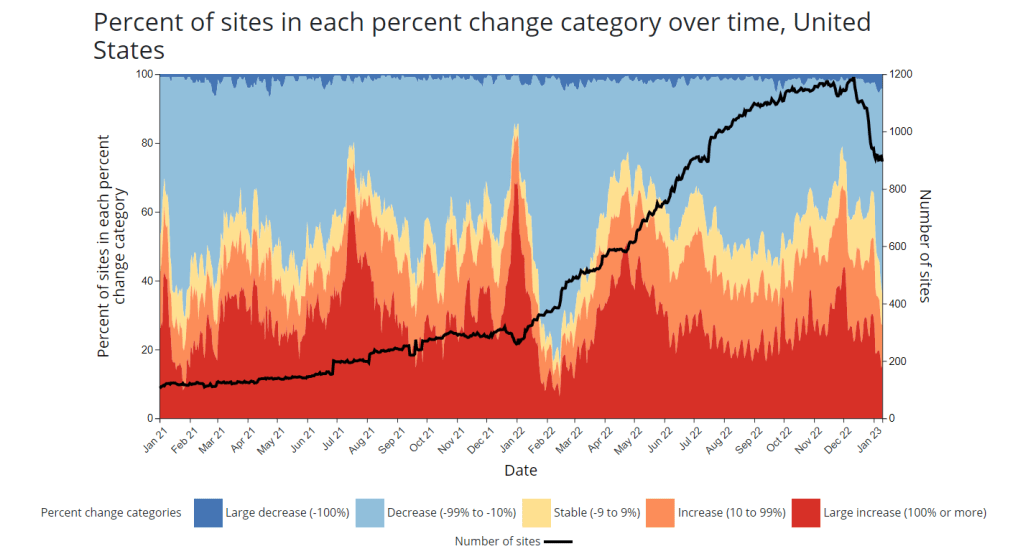
As 2022 brought on the decline of large-scale PCR testing, wastewater surveillance has proven itself as a way to more accurately track COVID-19 at the population level—even as some health departments remain wary of its utility. We also saw the technology’s use for tracking monkeypox, polio, and other conditions: the WastewaterSCAN project, for example, now reports on six different diseases.
This year, I expect that wastewater researchers and public agencies will continue expanding their use of this surveillance technology. That will likely mean more diseases as well as more specific testing locations, in addition to entire sewersheds. For example, we’re already seeing wastewater testing on airplanes. I’m also interested in following other, newer methods for tracking diseases, such as air quality monitors and wearable devices.
At the same time, these surveillance technologies will continue to face challenges around standardization and public buy-in. The CDC’s big contract with Biobot expires this month, and I’ve already noticed a decline in sites with recent data on the agency’s dashboard—will CDC officials and local agencies step in to fill gaps, or will wastewater testing become even more sporadic?
New variants, and how we track them
For scientists who track the coronavirus’ continued evolution, 2022 was the year of Omicron. We didn’t see all-new virus lineages sweeping the world; instead, Omicron just kept mutating, and mutating, and mutating. It seems likely that this pattern will continue in 2023, but experts need to continue watching the mutation landscape and preparing for anything truly concerning.
With declining PCR testing, public agencies and companies that track variants have fewer samples to sequence. (This led to challenges for the CDC team tracking XBB.1.5 over the holidays.) As a result, I believe 2023 will see increased creativity in how we keep an eye on these variants—whether that’s sequencing wastewater samples, taking samples directly from healthcare settings, increased focus on travel surveillance, or other methods.
Public health experts—and journalists like myself—also need to rethink how we communicate about variants. It’s no longer true that every new, somewhat-more-contagious variant warrants alarm bells: variants can take off in some countries or regions while having relatively little impact in others, thanks to differences in prior immunity, seasonality, behavior, etc. But new variants still contribute to continued reinfections, severe symptoms, Long COVID, and other impacts of COVID-19. Grid’s Jonathan Lambert recently wrote a helpful article exploring these communication challenges.
Long COVID and related chronic diseases
As regular readers likely know, Long COVID has been an increased topic of interest for me over the last two years. I’ve covered everything from disability benefits to mental health challenges, and am now leading a major project at MuckRock that will focus on government accountability for the Long COVID crisis.
Long COVID is the epidemic following the pandemic. Millions of Americans are disabled by this condition, whether they’ve been pushed out of work or are managing milder lingering symptoms. Some people are approaching their three-year anniversary of first getting sick, yet they’ve received a fraction of the government response that acute COVID-19 got. Major research projects are going in the wrong directions, while major media publications often publish articles with incorrect science.
For me, seeing poor Long COVID coverage elsewhere is great motivation to continue reporting on this topic myself, at MuckRock and other outlets. I’m also planning to spend more time reading about (and hopefully covering) other chronic diseases that are co-diagnosed with Long COVID, like ME/CFS and dysautonomia.
Ending the federal public health emergency.
Last year, we saw many state and local health agencies transition from treating COVID-19 as a health emergency to treating it as an endemic disease, like the many others that they respond to on a routine basis. This transition often accompanied changes in data reporting, such as shifts from daily to weekly COVID-19 updates.
This year, the federal government will likely do the same thing. POLITICO reported this week that the Biden administration is renewing the federal public health emergency in January, but will likely allow it to expire in the spring or summer. The Department of Health and Human Services has committed to telling state leaders about this expiration 60 days before it happens.
I previously wrote about what the end of the federal emergency could mean for COVID-19 data: changes will include less authority for the CDC, less funding for state and local health departments, and vaccines and treatments controlled by private markets rather than the federal government. I anticipate following up on this reporting when the emergency actually ends.
Transforming the U.S. public health system
Finally, I intend to follow how public health agencies learn from—or fail to learn from—the pandemic. COVID-19 exposed so many cracks in America’s public health system, from out-of-date electronic records systems to communication and trust issues. The pandemic should be a wakeup call for agencies to get their act together, before a new crisis hits.
But will that actually happen? Rachel Cohrs has a great piece in STAT this week about the challenges that systemic public health reform faces, including a lack of funding from Congress and disagreements among experts on what changes are necessary. Still, the window for change is open right now, and it may not be at this point in 2024.
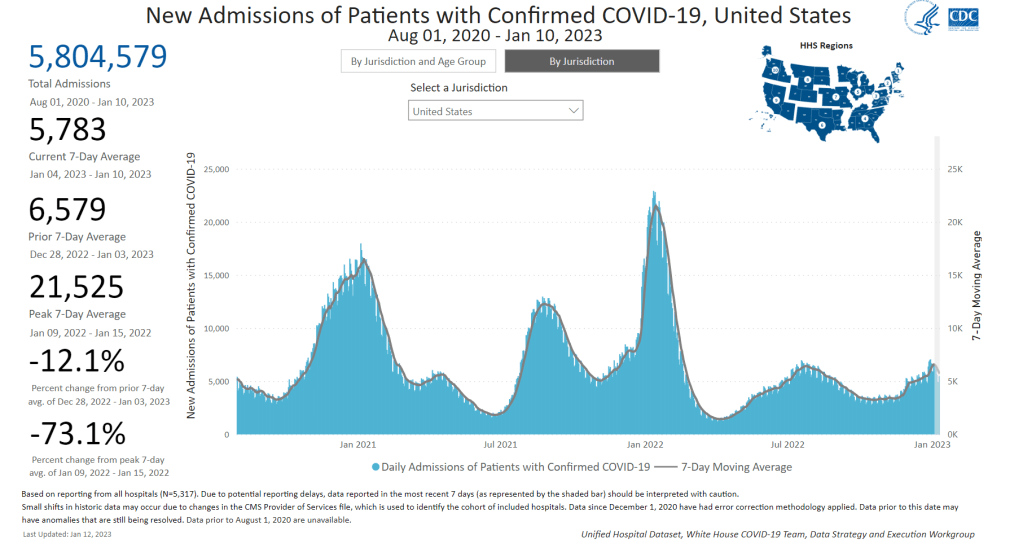
New hospital admissions for COVID-19 are starting to trend down, according to the CDC, though we’ll need more data to see if this trend persists.
In the past week (January 5 through 11), the U.S. officially reported about 420,000 new COVID-19 cases, according to the CDC. This amounts to:
An average of 59,000 new cases each day
126 total new cases for every 100,000 Americans
13% fewer new cases than last week (December 29-January 4)
In the past week, the U.S. also reported about 40,000 new COVID-19 patients admitted to hospitals. This amounts to:
An average of 5,800 new admissions each day
12.3 total admissions for every 100,000 Americans
12% fewer new admissions than last week
Additionally, the U.S. reported:
3,900 new COVID-19 deaths (560 per day)
43% of new cases are caused by Omicron XBB.1.5; 45% by BQ.1 and BQ.1.1 (as of January 14)
An average of 150,000 vaccinations per day (CDC link)
Last week, I wrote that a combination of holiday travel/gatherings and the latest Omicron subvariant, XBB.1.5, was driving a winter surge. This week, COVID-19 metrics suggest that the surge may have peaked, though we’ll need more data to say for sure—and XBB.1.5 remains a concern.
After reporting a significant increase in coronavirus levels through the end of December, Biobot’s wastewater dashboard is now showing downturns nationally and for all four U.S. regions. The CDC’s wastewater dashboard similarly shows that about two-thirds of sites in the National Wastewater Surveillance System have reported decreasing COVID-19 levels in the last two weeks, as of January 10.
“Importantly, this data is subject to change as we update 2x weekly,” Biobot’s Twitter shared on Thursday, when the company’s dashboard was most recently updated. “Stay tuned for Tuesday’s update.”
📣Our #Covid ww dashboard has been updated—https://t.co/GBL4twvGGT. We’re seeing a drop in concentrations in all regions, which may indicate the passing of the holiday surge. Importantly, this data is subject to change as we update 2x weekly. Stay tuned for Tuesday’s update.
Official COVID-19 cases and hospital admissions are also trending down, according to CDC data: new cases dropped by 13% from the week ending January 4 to the week ending January 11, while newly hospitalized patients dropped by 12%. But this trend isn’t universal; five states and Washington D.C. reported increased hospitalizations this week, with the biggest upticks in Rhode Island, Louisiana, and Maine.
XBB.1.5, the latest and most contagious Omicron subvariant, caused an estimated 43% of new cases nationwide in the week ending January 14, per the CDC. It’s clearly outcompeting BQ.1 and BQ.1.1 as well as a number of other strains in the “Omicron soup” we currently face, but is not taking over as quickly as we saw the original Omicron do in late 2021.
This strain continues to dominate the Northeast—particularly New England and New York/New Jersey—where COVID-19 spread is trending down. But it’s just starting to pick up in other parts of the country; to me, it seems likely that the Northeast had a holidays-and-XBB.1.5 combined surge, while other areas may face a second COVID-19 increase as this variant spreads more widely.
Meanwhile, other respiratory viruses continue to place additional burden on our health system. For example, the CDC recently released estimates about this year’s flu season, finding that the flu may have caused up to 560,000 hospitalizations and 48,000 deaths since fall 2022.
XBB.1.5 caused about 28% of new cases in the week ending January 7 (confidence interval: 14% to 47%), according to the CDC’s estimates.
You’ve probably seen it in the news this week: XBB.1.5 is the latest Omicron subvariant to spread rapidly through the U.S.
It is, of course, more transmissible and more capable of evading immunity from past infections than other versions of Omicron that have gone before it, as this lineage continues mutating. Scientists are still learning about XBB.1.5; it emerged from the U.S. during the holiday season, which has posed surveillance challenges. But we know enough to say that this variant is bad news for an already overstretched healthcare system.
Here’s a brief FAQ post on XBB.1.5.
Where did XBB.1.5 come from?
XBB, the parent of this latest lineage, emerged in Asia in October 2022. It evolved from Omicron BA.2 via recombination, which basically means two different BA.2 subvariants fused—likely while the same person was infected with both—and formed this new strain. (See my variants post from October for more details on XBB.)
XBB started spreading and mutating in the U.S. a few weeks later, leading to XBB.1.5. This subvariant was first identified in New York State in mid-December, though it could have evolved elsewhere in the northeast (since New York has better variant surveillance than some other states). Eric Topol’s newsletter has more details about XBB evolution.
New variant to watch
XBB.1.5 really taking off in New York, where it appears to have evolved
BQ.1* in NY has been almost flat since dominance in Nov
What are XBB.1.5’s advantages compared to other variants?
It spreads faster, likely because it is more capable of evading immune system protections from past infection or vaccination than other Omicron subvariants. In the U.S., CDC data suggests that XBB.1.5 is starting to outcompete other lineages in the “Omicron variant soup” we currently have circulating.
BQ.1.1 and XBB (original) were already known to be the best-evolved subvariants in this area before XBB.1.5 came along, according to this December 2022 paper in Cell. XBB.1.5 has taken this immune escape further, as it evolved a mutation called F486P that’s tied to this property.
“It’s crazy infectious,” Paula Cannon, a virologist at the University of Southern California, told USA TODAY reporter Karen Weintraub. Cannon added that protections that have worked against other coronavirus strains for the last three years will likely be less effective against XBB.1.5 and other new variants.
What questions are scientists currently working to answer about XBB.1.5?
One major question that arises with any new subvariant is severity: will XBB.1.5 have a higher capacity to cause severe symptoms than other coronavirus lineages? (We now know, for example, that Delta was more severe compared to prior variants.)
The World Health Organization is currently working on a report about XBB.1.5’s severity, according to POLITICO. Scientists and public health officials will also study whether current COVID-19 treatments work against this subvariant. Antiviral treatments Paxlovid and Mulnopiravir likely won’t be impacted, but Omicron’s continued evolution has put a lot of restrictions on monoclonal antibodies.
Another important question will be how well our updated booster shots work against XBB.1.5. The shots used in the U.S. were primed for BA.4 and BA.5, while XBB is derived (albeit indirectly) from BA.2, so our shots are not the best match. Still, antibody neutralization studies have shown that the shots provide protection against XBB, meaning some impact on XBB.1.5 is likely. This is a great time to get your booster if you haven’t yet.
What impact is XBB.1.5 currently having in the U.S.?
The subvariant caused about 28% of new cases in the week ending January 7, according to CDC estimates. These estimates have a fairly wide confidence interval, though, meaning that XBB.1.5’s true prevalence could be between 14% and 47%; the CDC will improve these estimates in the coming weeks as it collects more XBB.1.5 samples.
But we know with more confidence that XBB.1.5 has already taken over in the Northeast. It’s causing the vast majority of cases in HHS Region 1 (New England) and Region 2 (New York and New Jersey). Other mid-Atlantic states are catching up.
Some experts have noted that New York and other Northeast states are currently reporting rising COVID-19 hospitalizations, which could be a sign that XBB.1.5 causes more severe disease. It’s currently unclear how much the increased hospitalizations may be attributed to XBB.1.5’s presence, though, as the entire country is seeing this trend already in the wake of the holidays.
Sam Scarpino, a disease surveillance expert at Northeastern University, has a helpful Twitter thread explaining this issue. “It’s clear that XBB.1.5 is correlated [to] an increase in hospitalizations in many highly vaccinated states,” he writes. “I suspect it will hit harder in states with lower bivalent booster rates.”
1/ For those concerned about #XBB15 and hospitalizations, I think the evidence is more mixed than many are admitting.
While it's true hospitalizations are up in states like MA where XBB.1.5 is common, they are up across the entire US, even in states w/ little-to-no #XBB15! pic.twitter.com/LVrYqjn44K
Why has XBB.1.5’s prevalence been harder to pin down than other subvariants?
Many of the news articles you might have read this week about XBB.1.5 cited that the subvariant’s prevalence more than doubled in about one week, according to CDC estimates. But then the CDC’s estimates were revised down this week, suggesting that XBB.1.5 actually caused 18% of new cases in the last week of December—not 41%.
Why did the estimate change so dramatically? Well, it actually didn’t: as the CDC itself pointed out in its Weekly Review newsletter this Friday, the 41% estimate had a big confidence interval (23% to 61%), so the revision down to 18% was not far outside the existing realm of possibility. The CDC revises its variant estimates constantly as new data come in; this might be a bigger shift than we’re used to seeing, but it’s still pretty unsurprising.
The CDC’s variant forecasting team is also facing a couple of challenges unique to XBB.1.5 right now. First, this is a homegrown, U.S.-derived variant, so they don’t have a wealth of international sequences to analyze in preparation for a U.S. surge. And second, XBB.1.5 arose during the holidays, when a lot of COVID-19 testing and sequencing organizations were taking time off. The CDC is currently working with very limited data, but it will continue to revise estimates—and make them more accurate—as more test results come in.
For more info on the CDC’s process here, I recommend this Twitter thread from epidemiologist Duncan MacCannell:
The variant surveillance dashboard on the CDC COVID Data Tracker was just updated to include projections up to 1/7/2022; this is a weekly update that posts like clockwork every Friday. https://t.co/rnE66MCoHSpic.twitter.com/WGtfHix8va
How will XBB.1.5 impact the next phase of the pandemic?
Scientists will be closely watching to see how quickly XBB.1.5 spreads in other parts of the U.S., as well as how it performs in other countries that recently had surges of other Omicron subvariants.
Overall, the data we have about this subvariant so far suggest that it’s not distinct enough from other versions of Omicron to drive a massive new surge on the level of Omicron BA.1 last winter. But it’s still arriving in the wake of holiday travel and gatherings—and in a country that has largely abandoned public health measures that stop the virus from spreading.
In New York, for example, XBB.1.5 might not be the main cause of rising hospitalizations. Yet it is undoubtedly making more people sick with COVID-19, at a time when this region also faces continued healthcare pressure from flu and RSV. And an impending nurses’ strike won’t help the situation either, to put it mildly.
I think this Twitter thread from T. Ryan Gregory, an evolutionary biology expert who tracks coronavirus variants, is helpful at putting XBB.1.5 into context. This latest lineage follows other versions of Omicron that have kept the U.S. and other countries at relatively high levels of COVID-19 transmission throughout the last year. While our current moment may not look as dire as January 2022, we are currently seeing COVID-19 go up from an already-unsustainable baseline.
“BA.1 was the highest peak,” he writes, referring to 2022 in Canada and the U.K., “but the area under the curve of the others was as bad or worse.”
That said, I don't think "not as bad as the first Omicron wave" should be the standard. As noted, Canada, the UK, etc. had their deadliest year in 2022 through multiple Omicron waves. BA.1 was the highest peak, but the area under the curve of the others was as bad or worse. pic.twitter.com/5JwU857oHo
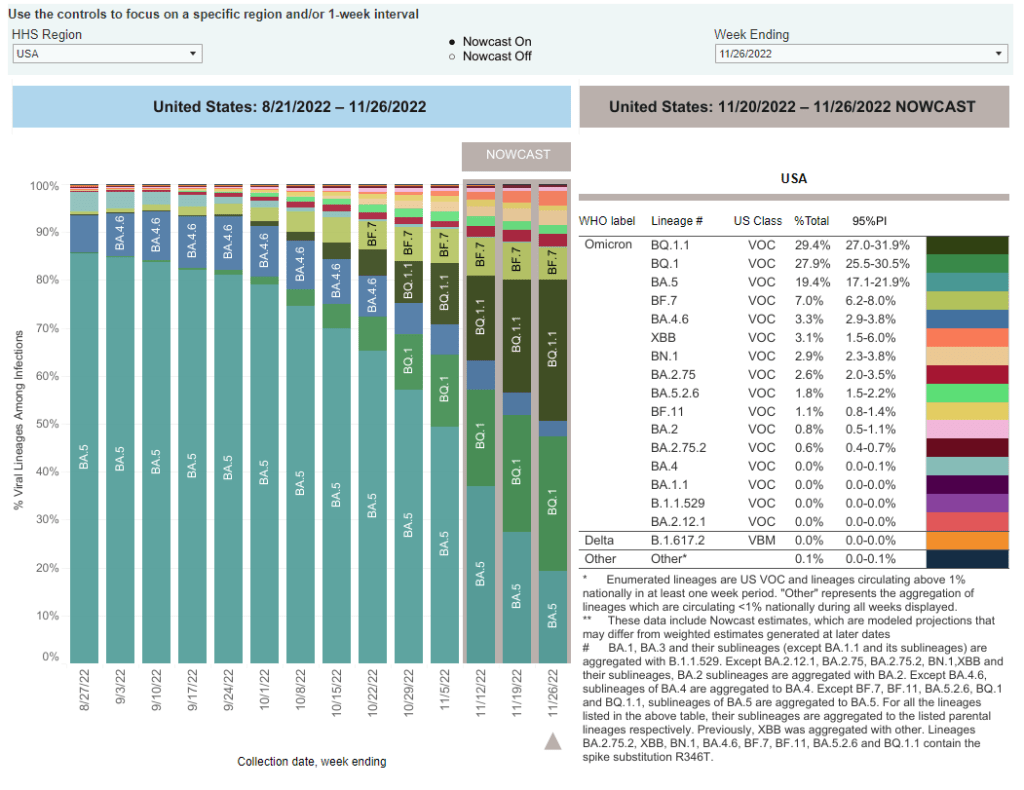
BA.5 sublineages BQ.1 and BQ.1.1 are now the dominant variants in the U.S., while newer lineage XBB has made an appearance. Chart via the CDC.
In the past week (November 17 through 23), the U.S. reported about 310,000 new COVID-19 cases, according to the CDC. This amounts to:
An average of 44,000 new cases each day
93 total new cases for every 100,000 Americans
8% more new cases than last week (November 10-16)
In the past week, the U.S. also reported about 24,000 new COVID-19 patients admitted to hospitals. This amounts to:
An average of 3,400 new admissions each day
7.2 total admissions for every 100,000 Americans
0.2% more new admissions than last week
Additionally, the U.S. reported:
2,600 new COVID-19 deaths (380 per day)
57% of new cases are caused by Omicron BQ.1 and BQ.1.1; 7% by BF.7; 3% by BN.1; 3% by XBB (as of November 26)
An average of 300,000 vaccinations per day
Nationwide, reported COVID-19 cases went up last week: the CDC reports 8% more cases in the week ending November 23 than in the week ending November 16. Wastewater monitoring also suggests a pre-Thanksgiving uptick, according to Biobot, while new hospitalizations have been at a plateau.
All eyes will be on wastewater data in the next couple of weeks, to look for potential spread after Thanksgiving travel and gatherings. We likely won’t see any immediate spikes in case data thanks to the data delays that always happen after holidays, but wastewater surveillance is less susceptible to these delays (and less biased by behavioral patterns). To look for wastewater data in your community, see the COVID-19 Data Dispatch’s resource page.
Any outbreaks we see in the coming weeks will likely be driven by newer coronavirus variants, combining forces with holiday behavior. Omicron subvariants BQ.1 and BQ.1.1 caused about 57% of new COVID-19 cases in the week ending November 26, according to CDC estimates; the BQ lineage is more transmissible than its parent variant, BA.5, though it has not caused major case spikes in the U.S. yet.
The CDC’s latest variant update also provides estimates on XBB, a subvariant that evolved from BA.2 and that has caused new surges in some Asian countries. XBB caused about 3% of new cases in the last week, the agency estimates, with higher prevalence in the Northeast and West coast. Health officials are closely watching XBB due to the many mutations on its spike protein, but it’s unclear whether this subvariant alone could cause a new surge.
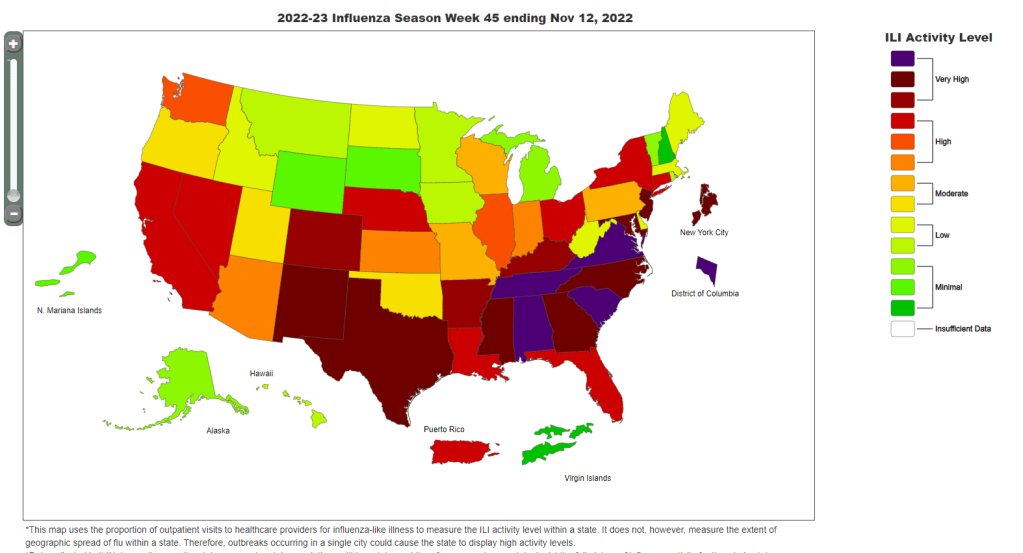
As we watch for new COVID-19 outbreaks, healthcare systems—especially children’s hospitals— across the country are already facing intense pressure from the flu, RSV, and other respiratory viruses. Many states, particularly on the East coast and in the South, continue to report very high levels of influenza-like activity, according to the CDC.
If you took part in a Thanksgiving gathering over the last few days: this week, you should look out for any respiratory symptoms and consider getting a PCR test, if you can. If possible, get a test that will check for COVID-19, the flu, and RSV at once. Make sure any disease spread stops with you!
Data from the CDC indicate that much of the country is seeing high flu levels. Chart as of November 12.
In the past week (November 10 through 16), the U.S. reported about 280,000 new COVID-19 cases, according to the CDC. This amounts to:
An average of 40,000 new cases each day
86 total new cases for every 100,000 Americans
3% fewer new cases than last week (November 3-9)
In the past week, the U.S. also reported about 24,000 new COVID-19 patients admitted to hospitals. This amounts to:
An average of 3,400 new admissions each day
7.3 total admissions for every 100,000 Americans
1% fewer new admissions than last week
Additionally, the U.S. reported:
2,200 new COVID-19 deaths (320 per day)
50% of new cases are caused by Omicron BQ.1 and BQ.1.1; 8% by BF.7; 5% by BN.1; 2% by BA.2.75 and BA.2.75.2 (as of November 19)
An average of 400,000 vaccinations per day
Nationwide, reported COVID-19 cases and new hospital admissions are still in a plateau; both metrics declined very slightly this week after rising slightly last week (declining by 3% and 1%, respectively).
While we have yet to see as clear of a fall/winter surge as we did in the last two years, infection levels are still quite high. Evidence for this comes from wastewater data, which doesn’t rely on people getting PCR tests; trends from Biobot suggest that viral transmission is at a similar level to late October/early November of last year, when Delta was still the dominant variant.
Biobot’s data also indicate that the West coast region is now seeing a notable uptick in COVID-19 spread, taking over from the Northeast (which has been a regional hotspot since September). Wastewater testing sites in cities like Los Angeles is reporting significant transmission spikes in the last couple of weeks.
The West coast, like the Northeast, has been a hotspot for newer Omicron subvariants BQ.1 and BQ.1.1, according to CDC estimates. Nationwide, the BQ lineage caused about half of new cases in the last week—solidly outcompeting its parent lineage, BA.5. And there are several other Omicron subvariants spreading, including two lineages from BA.2, BF.7 and BN.1.
With all these new variants circulating and colder weather throughout the country, why haven’t we seen a significant jump in COVID-19 spread? It’s possible that the U.S. has enough prior immunity from vaccinations and past infections to prevent a big surge, White House COVID-19 coordinator Ashish Jha said at the STAT Summit last week.
I hope Jha is right, but I personally remain skeptical. Way too few people have received the new booster shots that protect against Omicron variants, while we’re heading into several weeks of holiday travel and gatherings—with fewer COVID-19 protections than in the last two years.
At the same time, the U.S. is dealing with flu and RSV surges. About a dozen states, plus New York City and Washington, D.C., reported “very high” levels of influenza-like activity in the week ending November 12, according to the CDC. And the country’s RSV wave continues at high intensity, though it might be reaching its peak.
These two respiratory diseases may be less severe than COVID-19 at an individual level (especially accounting for the burden of Long COVID), but they can still put intense pressure on healthcare systems—especially those focused on treating children. Wearing a mask, avoiding indoor crowds, improving ventilation, and other measures can protect against all three diseases.
COVID-19 hospitalizations have risen slightly in recent weeks, indicating the start of a fall/winter surge, according to CDC data.
In the past week (November 3 through 9), the U.S. reported about 290,000 new COVID-19 cases, according to the CDC. This amounts to:
An average of 41,000 new cases each day
88 total new cases for every 100,000 Americans
6% more new cases than last week (October 27-November 2)
In the past week, the U.S. also reported about 24,000 new COVID-19 patients admitted to hospitals. This amounts to:
An average of 3,500 new admissions each day
7.4 total admissions for every 100,000 Americans
5% more new admissions than last week
Additionally, the U.S. reported:
2,300 new COVID-19 deaths (340 per day)
44% of new cases are caused by Omicron BQ.1 and BQ.1.1; 8% by BF.7; 2% by BA.2.75 and BA.2.75.2 (as of November 12)
An average of 400,000 vaccinations per day
We are beginning to see the impacts of colder weather and new variants this week, as both official COVID-19 cases and new hospital admissions went up slightly: increasing by 6% and 5% from the prior week, respectively.
Wastewater monitoring similarly shows an uptick in coronavirus transmission at the national level, according to Biobot’s dashboard. The Northeast still has the highest virus concentration, but other regions of the country are catching up—particularly the West coast, which reported a significant increase in the last two weeks.
About half of the wastewater surveillance sites included on the CDC’s national dashboard reported increases in coronavirus transmission over the two-week period ending November 7, with 30% of sites reporting increases of at least 100%.
Omicron BQ.1 and BQ.1.1 are likely a major source of increased virus spread. These two strains—subvariants of BA.5 that are even more contagious—now account for 44% of new cases in the week ending November 12, according to CDC estimates. New variants tend to have an impact on transmission when they reach about 50% prevalence, so we will likely see more BQ-driven spread in the weeks to come.
The New York/New Jersey region continues to report the highest amounts of BQ.1 and BQ.1.1: these variants represented about 60% of new cases in the last week. These two states also reported some of the highest (official) case rates in the country last week, along with Puerto Rico, New Mexico, and North Dakota, per the latest Community Profile Report. Cases and hospitalizations in New York City, often a bellwether for the rest of the country, are rising again.
At the same time, the U.S. is seeing an early and intense flu season. Most of the country’s Southeast region (from Virginia to Mississippi) reported the highest possible levels of influenza-like activity in the week ending November 5, according to the CDC. Flu, COVID-19, and RSV are all straining hospitals as we head into the holiday season.
The new, Omicron-specific booster shots provide enhanced protection against the latest variants, but uptake remains very low—as shown by new CDC data providing vaccinations by state. Only 10% of the eligible population has received one of the new shots, as of November 9.
2/ Here is where we stand on the % of the population who has received the bivalent booster, for 4 age groups: – 5-11 years (national 0.5%) – 12-17 years (national 2.6%) – 18-64 years (national 6.4%) – 65+ years (national 23%)
In the program—which is a collaboration between the agency’s Travelers Health Branch, biotech company Ginkgo Bioworks, and airport wellness company XpresSpa Group—travelers at four major airports can volunteer to be swabbed right after they get off the plane. The travelers’ test results are pooled by country of origin, meaning that analysts at Ginkgo combine their samples and PCR-test them together.
In addition to test positivity, Ginkgo also sequences the samples to identify variants spreading around the world. The program has included about 60,000 people between November 2021 and September 2022, according to the CDC. It’s now expanding to add more airports, with the CDC and Ginkgo working together to select international flights that should be targeted for testing.
Earlier this week, I talked to bioinformatics experts Andy Rothstein and Casandra Philipson, who work on the CDC travel surveillance program at Concentric (Ginkgo’s COVID-19 testing initiative), to learn more about how the program works. Swati Sureka from Ginkgo’s communications team also took part in the interview.
Here are a few key insights I learned from the conversation:
Travelers who volunteer to be tested don’t actually receive individual results back from Ginkgo, due to the company’s pool testing method. But they receive free at-home tests that can provide individual results.
Despite a relatively small sample size, the surveillance program tends to match global coronavirus variant trends from GISAID (a global repository of variant sequences).
The CDC uses data from this program as a complementary surveillance system, in coordination with the agency’s domestic variant surveillance, wastewater testing, and other systems.
Along with expansions to more airports, the Concentric scientists are working on testing wastewater from airplanes as another way to pull COVID-19 data from international travelers.
The experts named BQ.1 and BQ.1.1 as the most concerning variants they’re following right now, though the program has also picked up XBB.
This interview has been lightly edited and condensed for clarity.
Betsy Ladyzhets: I wanted to start by asking about the backstory behind the traveler-based genomic surveillance program. I’ve read a bit about it, but I’m curious to hear from you guys about how it got started and choices that have been made as you’ve expanded the program.
Andy Rothstein: Gingko has long recognized that biosecurity is an integral component to the growing bio-economy, even before COVID. But when spring 2020 came around, Ginko as an organization rapidly responded with a large commitment to the sequencing effort across the country… That really showed that there was an opportunity to grow a biosecurity business unit within Gingko, which became Concentric.
We built a K through 12 testing program, where we implemented this novel approach of pooled testing. We could have kindergarteners basically swabbing their noses in the classroom, everyone could put it one tube, it simplified the process, and we were able to get those results out quickly. But we really recognized that this is just one interface that can be a part of the biosecurity infrastructure.
We saw that travelers were this really important sentinel for bringing in new things like variants or tracking lineages. And we could combine the pooled testing approach with our sequencing capability at Ginkgo. Then, we got in contact with XpresSpa [now XpresCheck], which was pivoting their business model as well, because no one was going in the airports for manicures and massages. We approached them, as well as the CDC branch that deals with travel histories, quarantining, and things like that. We came to them to launch a pilot program in September 2021 as a proof of concept to say like, “Is this an interface that could provide valuable insights for public health and the CDC?”
We didn’t really know whether or not the pilot would work out. But we were one of the first to detect Omicron coming into the country in November [2021]. The program has now expanded, as of August 2022, into a two year program. And we’ve consistently been able to show that there’s real value in early warning, early detection through this novel interface.
Casandra Philipson: Gingko is an organism engineering company, we know that we’re going to be living with engineered organisms in the future. I think, because of that our founders have always had this prerogative to be able to have an early warning system or anomaly detection system for threats, whether or not they’re natural or manmade. And we have a lot of really smart people who had previous experience, in, like, Department of Defense surveillance exercises in the past. So I think there was an interest in early warning signals.
It’s also hard to be able to do surveillance in other countries, at least at that early, pandemic phase. And so this was a really easy way to have access to things that were coming in from other countries, that we otherwise wouldn’t have had access to.
BL: Yeah, that makes a lot of sense. I’m curious, building off of that, how is the CDC using the data that comes out of this program? Is it mostly about new variants? Or are there other things they’re kind of doing with it?
AR: CDC has a lot of complimentary surveillance systems ongoing, especially for SARS-CoV-2, that they’ve built up, whether it be clinical or whether it be wastewater. This is a novel interface for them to be detecting new things coming into the country. And so we really help source and, I guess, consolidate what is coming into the country and whether or not it’s a bad thing, or part of the existing evolution of SARS-CoV-2.
We work in tandem with them weekly, to not only optimize this program, but also give insights into the data that’s coming out. The [travel surveillance page of the] COVID Data Tracker has been a good culmination of all of this work that we’ve been doing. We can broadcast that publicly and show, almost side-by-side, here’s what’s happening in United States; here’s what’s happening, potentially coming into the United States.
BL: I did want to ask more about that new page on the COVID tracker, because I’m curious what you would want the average viewer to take from those charts. What should folks be getting out of both the test positivity rate and the variants?
AR: The first part is this test positivity rate. What we’ve seen is that, as testing declines in countries around the world, whether that’d be the appetite for testing or the funding for testing, we have a new sentinel to see what, potentially, the positivity looks like around the world. There’s been a number of times that we, in our program, have matched positivity rates in a country of origin [for a group of travelers]. Then as testing stopped [in that country], we still are picking up a positivity rate. For the public that is looking at this chart, it’s an opportunity to see into the window: What’s the global picture of what’s coming into this country?
Positivity is the first lens of data. The next is that we actually sequence, and we are understanding what is the breakdown or the frequencies of different variants coming into the country. You can see how what’s happening on [the CDC’s U.S. variant surveillance page] is lining up with the frequencies in our program. And because we’re finding new things, we end up sort-of being ahead of the curve in terms of what those frequencies might end up being in the United States.
BL: So you’re talking about comparing the CDC’s variant proportions estimates versus the travel estimates.
AR: Yeah, exactly. And the wastewater estimates… Not everybody is necessarily going and seeking testing when they’re sick with COVID, they might be doing an at-home test. So we’re using all of those [data systems] in a complementary sense to find, like, what’s a holistic picture of the SARS-CoV-2 coming in and outside of the United States?
BL: I also wanted to ask about, so like, if I’m a traveler coming into the U.S. at one of these airports where you have this program, how is it advertised? And what do people learn about it when they decide to volunteer to get tested?
AR: We have these pop-up testing booths, in collaboration with XpresCheck. They’re our on-the-ground infrastructure to basically be recruiting folks coming off of international flights. All the international flights go into one bottleneck where you’re going to leave the terminal, and you have an opportunity to see this booth that has some information about like, testing for public health, with the CDC logo—basically recruiting folks to come in. Folks that volunteer, they swab their noses and then we are pooling [tests] by those countries. We also have been giving them free, individual tests to take home.
We’re not collecting or giving back individual testing data to [the volunteers]. But we are showing that this is a part of the public health program. What we’ve found, through survey results, is that participation has really been increased by the fact that people feel like they’re being a part of this public health program and they want to help. We have great recruiters on the ground.
BL: So people don’t get their individual results, but you said they get an at-home test that they can use?
AR: Yeah. And then they can get their individual results [from that test]… They don’t get the pooled result.
BL: Are the data that you’re getting from this program linked to any other data? Because I know one big concern with variants is like, is a new variant going to be more severe? Is it going to be more likely for people to be hospitalized? So is there any capacity to link the tests that you’re doing with, say, hospitalization records?
AR: I think it’s a great idea, a great direction. Right now, we haven’t been linking those clinical data… We can try to look at the data within our program, and then contextualize it [using other sources] on what might be happening, in the United States or in origin countries.
But we’ve also been really excited about expanding our passive detection through wastewater. We’ve done an R&D project where we were looking at wastewater testing off of aircraft. So, that’s another complimentary data set off of the aircraft itself to help get a more holistic picture—not everyone is going to be using the bathroom [on the plane], but not everyone is going to be volunteering in this program.
BL: Testing the wastewater off the airplane seems like a great idea, I would not have thought of that.
AR: Yeah, we’re really excited about the opportunity to do something along those lines, since folks aren’t always going to volunteer to swab their nose.
We’re pooled testing by country, so we know that folks are coming from specific places. We can also—they can volunteer to give us any past travel history, so that we can try to link those data on our own. But there’s no systematic way to link [our results] to clinical data.
CP: Our sweet spot is microbes and viruses. So we actually don’t collect individual data that would allow us to associate an individual with their health record at all. I just wanted to emphasize that.
BL: That makes sense. I know that [linking datasets] is something that is very challenging to do, even with established health systems. I was just curious.
Swati Sureka: I can add one thing, just in terms of the knock-on benefits of the program. Say we do get early warning of an emerging variant that could potentially be of concern, that we don’t know on the global stage yet. We work directly with the CDC on getting them access to those [test] samples so that they can do direct viral characterization. Because, with emerging variants, it’s hard to get your hands on samples of it to be able to conduct research on how the virus behaves. I think that’s one of the side benefits, being able to actually pull those samples and share them directly with the CDC.
BL: Are there any variants that you’re all particularly watching right now? Like, I know, there’s been a lot of news about XBB, that’s spreading in East Asia. From your perspective, what are you seeing as concerning hotspots at the moment?
AR: Yeah. This is a big part of what our team does: as this data comes in, understanding what might be the trends happening globally. We have repeatedly shown that we can do early warning, [our data are] some of the first to identify a variant of concern. We can look and say, like, there’s certain mutations that we know, either from past variants or in predictive space, that [indicate this new variant is] going to be a problem for immune escape.
Variants that I think we’ve been really keeping an eye on and telling our CDC partners about are BQ.1 and BQ.1.1, which have been split out by CDC in the last couple of weeks. Our program was one of the first to identify and actually designate this BQ.1 variant. So we saw, early on, that it had characteristics because of its mutational profile [allowing it to] take hold. We continue to watch that.
The United States has been, pretty much, a few weeks to a month behind trends that we see in Western Europe. So I think it’s been pretty clear that BQ.1 is going to be something to watch for, as it sort of expands in its frequency… We also see XBB in our program, we’ve seen it as well. I think it’s going to be an interesting new chapter of SARS-CoV-2 evolution where we have potentially co-circulating variants of concern that have different dynamics in different parts of the world.
BL: Yeah, it’s very interesting… One other thing I wanted to ask you about is sample size. It seems like, from the data on the CDC dashboard, that you’re working with a small number of airports and a limited sample, compared to the number of international travelers coming into the U.S. So how do you think about analyzing that, and potentially expanding the sample?
AR: Definitely part of our plan is to ramp up the number of samples that we can get, as well as the number of airports that we might be operating out of.
But I think it’s just remarkable to talk about this program, when you see such a small sample size, and we’re still able to find new things and match GISAID, or global variant frequencies. It highlights, even with a small sample size, that the way that we’ve designed the program and the way our CDC counterparts think about where we’re going to be, what flights are we going to be choosing—that has been really, really successful so far. You always want more samples in science, but I think we’re working with what we have, and we’re excited to be expanding.
BL: That makes sense. So you’re able to say, “We want to send people to these flights, because this country has concerting variants right now,” that kind of thing?
AR: Yeah. Our CDC counterparts are tapped into both the CDC-wide conversations about variants and the global, WHO conversations about variants. So they’ll give us indications when there might be something to think about. And, again, this program is super nimble in its ability to pivot. When we think we want to focus on certain regions of the world, [we can recruit from specific flights].
It’s nice to be working in airports that have these direct flights and these long-haul flights. But thinking about how we prioritize is definitely—the CDC folks are thinking about this, and we sort-of help support them.
BL: The last main thing I wanted to ask about is, obviously in the U.S. and globally, we’re seeing so much less PCR testing now than we had at earlier points in the pandemic. How are you and—to any extent that you can talk about it—how are partners at the CDC thinking about making sure that we’re collecting a lot of samples from diverse settings, and looking in different places, looking at wastewater, and just continuing to keep track of what variants are circulating?
AR: I think back to, finding novel places to sample things. Like, the fact that we’ve invested and tried to build capability to do aircraft wastewater testing is just adding a complementary [data layer]. We’re going to have this layered interface or layered system where we might have some PCR tests, we might have wastewater, we might have sequencing, we might not have sequencing.
We’re figuring out, how do we just keep adding and keep building on this biosecurity infrastructure. I mean, the worst thing that could happen from this is we build all this and then no one uses it again, until something pops up. We’re really invested in finding new and novel ways to sample and to detect, and eventually sequence if we can get more robust data, like on variants.
BL: That makes sense. I wonder to what extent it can one day be useful for other viruses, too. I know we’re in a bad flu moment right now, or at least the beginnings of maybe a more intense flu season this year. And I know experts always talk about, like, “Can we read the tea leaves from the Southern hemisphere?” So that makes me think, “Okay, could we actually sample people who are coming in? And see if they have the flu, and not just COVID?” Or other things of that nature?
CP: This is something that keeps me up at night. Without being too forward-looking, absolutely, I would say, there are some commercial products out there right now—like from Illumina, which is a massive sequencing behemoth, they’ve just released some new sequencers on their end. They have this panel of, like, 66 viruses that you can detect in one panel. I think we’re gonna see more of that from many different types of partners who are looking at surveillance.
Moving beyond SARS-CoV-2, could samples be used for that? We’ve seen lots of publications that definitely prove that’s true. I think it’s right on cue, hopefully, with where we’re all headed.
BL: Yeah, I hope so. Well, those were all my main questions. Is there anything else you all think would be important for me to know about the program?
Swati Sureka: Stepping back, seeing how this [program] has played out over the past year, I’ve just been floored by, like, tens of thousands of people who have mobilized and participated and given samples in service of public health. For me, as a person who works in the communications space, I think we often hear a lot of these narratives of like, “People aren’t gonna do anything” or take any measures that they’re not forced to do.
People are inherently self-interested in all of these narratives that we hear. And it’s been really impressive to watch the participation that we’ve seen from travelers who want to help public health and want to help stop the spread, want to help pick up new variants. I don’t want to lose that thread of things.
BL: Totally. I can just envision, if you’re coming off a long flight, you just want to get through customs and get home. Taking a few extra minutes to get swabbed is not nothing.
AR: Yeah. And you could be doing that and say, “Oh, it doesn’t matter.” But we’re consistently seeing how helpful this data is, to inform all these complementary systems for building a biosecurity infrastructure. It’s really important data as we move forward.
BL: Yeah. When folks sign up, do you give them a link to the dashboard?
AR: Now we do. Now we can, right, it’s now live. It’s been really nice to have that public-facing thing, so that folks know where their efforts are going towards.
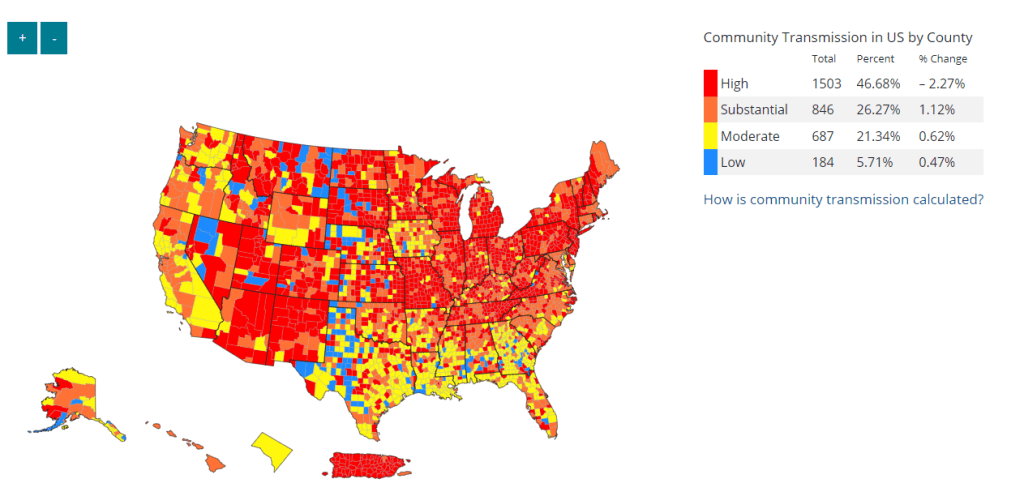
Despite significant undercounting of COVID-19 cases, the CDC’s Community Transmission Levels (based on case rates and test positivity) are high enough to suggest the majority of the country should be masking. Data here are as of November 2.
In the past week (October 27 through November 2), the U.S. reported about 270,000 new COVID-19 cases, according to the CDC. This amounts to:
An average of 39,000 new cases each day
83 total new cases for every 100,000 Americans
5% more new cases than last week (October 20-26)
In the past week, the U.S. also reported about 23,000 new COVID-19 patients admitted to hospitals. This amounts to:
An average of 3,300 new admissions each day
7.0 total admissions for every 100,000 Americans
1% fewer new admissions than last week
Additionally, the U.S. reported:
2,500 new COVID-19 deaths (360 per day)
35% of new cases are caused by Omicron BQ.1 and BQ.1.1; 9% by BF.7; 4% by BA.2.75 and BA.2.75.2 (as of November 5)
An average of 400,000 vaccinations per day
Continuing a trend from the last few weeks, nationwide COVID-19 cases and hospitalizations are still at plateaus or trending very slightly downward. We aren’t clearly in a fall surge yet, but concerning newer Omicron subvariants are rising—along with other respiratory diseases.
National wastewater trends are also still suggesting plateaus or downturns in coronavirus transmission, according to Biobot’s dashboard. The Northeast’s wastewater saw a major drop in coronavirus concentration over the last couple of weeks while other regions are at high, but steady levels.
As always, it’s important to remember that official case data are significantly undercounted. True infections are likely around 20 times higher than reported cases, though even that factor is difficult to estimate at this point in the pandemic.
Despite the undercounting, the CDC’s Community Transmission Levels (based on case rates and test positivity) suggest that 75% of U.S. counties are experiencing “high” or “substantial” coronavirus spread. If we had more accurate data, that number would likely shoot up to 100%. In other words, even today’s seemingly-low and underestimated case numbers are still high compared to earlier periods of the pandemic.
Newer versions of the Omicron variant will likely drive continued COVID-19 spread this fall. BQ.1 and BQ.1.1 have emerged as the most competitive subvariants and are quickly taking over from their parent lineage, BA.5. These two subvariants caused about 35% of new cases in the U.S. in the week ending November 5, according to the CDC’s estimates, while BA.5 caused 39%.
The BQs are most prevalent in the Northeast, especially New York and New Jersey: these subvariants caused over 50% of new cases in the NY/NJ region last week, according to the CDC. These two states and Connecticut also had the highest per-capita COVID-19 hospitalization rate last week, per the HHS Community Profile Report.
As hospitals around the country brace for a winter COVID-19 surge, they’re already dealing with high transmission of the flu. Flu hospitalizations have not been as high as they are this season since 2010-2011, the CDC reports. Last week, Washington D.C., Tennessee, South Carolina, and Alabama reported influenza-like illness rates so high that the CDC needed a new map color to express it.
Even if COVID-19 isn’t (yet) surging in your community, this is a good time to stock up on high-quality masks and rapid tests, and plan holiday gatherings that will keep friends and family members safe. Your Local Epidemiologist has a helpful guide for the latter.