Category: Federal data

  • Ending emergencies will lead to renewed health equity issues

    Ending emergencies will lead to renewed health equity issues

    The header image from a story I recently had published in Amsterdam News about declining access to COVID-19 services.

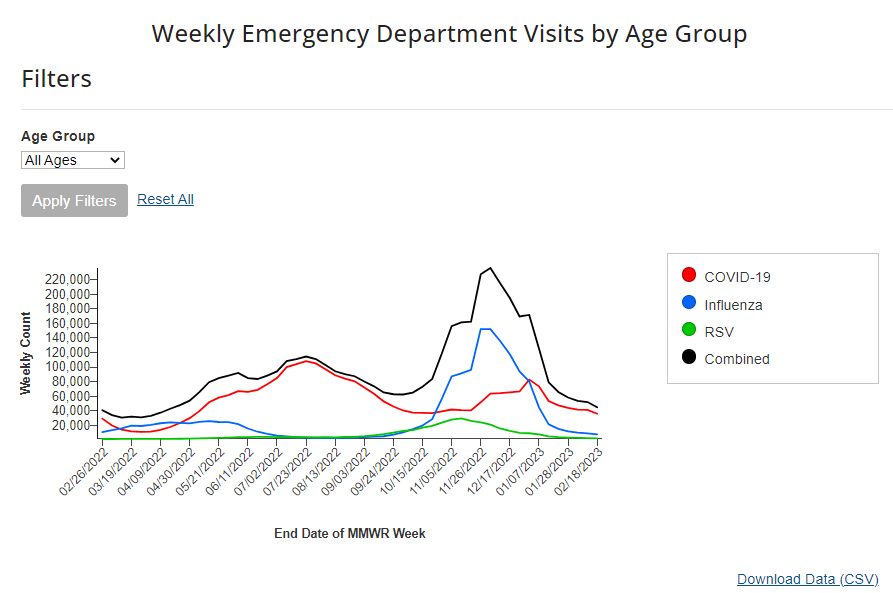
    Last week, I gave you an overview of the changes coming with the end of the federal public health emergency (PHE), highlighting some shifts in publicly available COVID-19 services and data. This week, I’d like to focus on the health equity implications of the PHE’s end.

    COVID-19 led the U.S. healthcare system to do something unprecedented: make key health services freely available to all Americans. Of course, this only applied to a few specific COVID-related items—vaccines, tests, Paxlovid—and people still had to jump through a lot of hoops to get them. But it’s still a big deal, compared to how fractured our healthcare is for everything else.

    The PHE allowed the U.S. to make those COVID-19 services free by giving the federal government authority to buy them in bulk. The federal government also provided funding to help get those vaccines, tests, and treatments to people, through programs like mass vaccination sites and mobile Paxlovid delivery. Through these programs, healthcare and public health workers got the resources to be creative about breaking down access barriers.

    Now that the emergency is ending, those extra supplies and resources are going away. COVID-19 is going to be treated like any other disease. And as a result, people who are already vulnerable to other health issues will become more at risk for COVID-19.

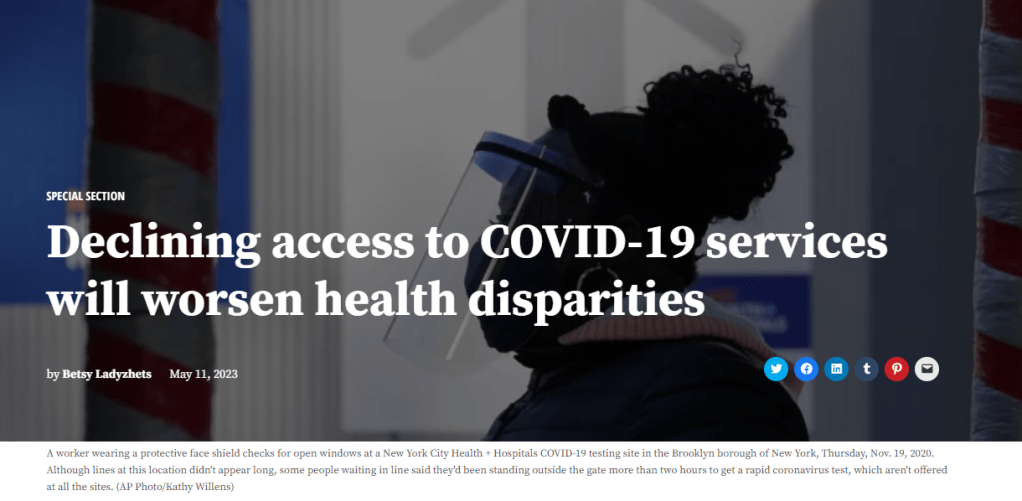
    I wrote about this health equity problem in a recent story for Amsterdam News, a local paper in New York City that serves the city’s Black community. The story talks about how COVID-19 services in NYC are changing with the end of the PHE, and who will be most impacted by those changes. It’s part of a larger series in the paper covering the PHE’s end.

    Most of the story is NYC-specific, but I wanted to share a few paragraphs that I think will resonate more widely:

    Jasmin Smith, a former contact tracer who lives in Brooklyn, worries that diminished public resources will contribute to increased COVID-19 spread and make it harder for people with existing health conditions to participate in common activities, like taking the subway or going to the grocery store.

    COVID-19 safety measures “make the world more open to people like myself who are COVID-conscious and people who might be immunocomprmised, disabled, chronically ill,” Smith said. “When those things go away, your world becomes smaller and smaller.”

    The ending federal public health emergency has also contributed to widespread confusion and anxiety about COVID-19 services, [said Dr. Wafaa El-Sadr, a professor of epidemiology and global health at Columbia University’s Mailman School of Public Health]. “People have so many questions about this transition,” she said, and local leaders could do more to answer these questions for New Yorkers.

    The near future of COVID-19 care in the U.S. could reflect existing health disparities for other endemic diseases, like the seasonal flu and HIV/AIDS, [said Steven Thrasher, a professor at Northwestern University and author of the book, The Viral Underclass]. For example, people with insurance and a primary care physician are more likely to get their annual flu shots, he said, while those without are more likely to face severe outcomes from the disease.

    After May 11, COVID-19 outcomes are likely to fall along similar lines. “More people have died of AIDS after there were HIV medications,” Thrasher said. “More people have died of COVID when there were vaccines in this country than before.”

    For more news and commentary on COVID-19 emergencies ending, I recommend:

  • The federal public health emergency ends next week: What you should know

    The federal public health emergency ends next week: What you should know

    A chart from the CDC’s recent report on surveillance changes tied to the end of the federal public health emergency.

    We’re now less than one week out from May 11, when the federal public health emergency (or PHE) for COVID-19 will end. While this change doesn’t actually signify that COVID-19 is no longer worth worrying about, it marks a major shift in how U.S. governments will respond to the ongoing pandemic, including how the disease is tracked and what public services are available.

    I’ve been writing about this a lot in the last couple of months, cataloging different aspects of the federal emergency’s end. But I thought it might be helpful for readers if I compiled all the key information in one place. This post also includes a few new insights about how COVID-19 surveillance will change after May 11, citing the latest CDC reports.

    What will change overall when the PHE ends?

    The ending of the PHE will lead to COVID-19 tests, treatments, vaccines, and data becoming less widely available across the U.S. It may also have broader implications for healthcare, with telehealth policies shifting, people getting kicked off of Medicaid, and other changes.

    Last week, I attended a webinar about these changes hosted by the New York City Pandemic Response Institute. The webinar’s moderator, City University of New York professor Bruce Y. Lee, kicked it off with a succinct list of direct and indirect impacts of the PHE’s end. These were his main points:

    • Free COVID-19 vaccines, tests, and treatments will run out after the federal government’s supplies are exhausted. (Health experts project that this will likely happen sometime in fall 2023.) At that point, these services will get more expensive and harder to access as they transition to private healthcare markets.
    • We will have fewer COVID-19 metrics (and less complete data) to rely on as the CDC and other public health agencies change their surveillance practices. More on this below.
    • Many vaccination requirements are being lifted. This applies to federal government mandates as well as many from state/local governments and individual businesses.
    • The FDA will phase out its Emergency Use Authorizations (EUAs) for COVID-19 products, encouraging manufacturers to apply for full approval. (This doesn’t mean we’ll suddenly stop being able to buy at-home tests—there’s going to be a long transition process.)
    • Healthcare worker shortages may get worse. During the pandemic emergency, some shifts to work requirements allowed facilities to hire more people, more easily; as these policies are phased out, some places may lose those workers.
    • Millions of people will lose access to Medicaid. A federal rule tied to the PHE forbade states from kicking people off this public insurance program during the pandemic, leading to record coverage. Now, states are reevaluating who is eligible. (This process actually started in April, before the official PHE end.)
    • Telehealth options may become less available. As with healthcare hiring, policies during the PHE made it easier for doctors to provide virtual care options, like video-call appointments and remote prescriptions. Some of these COVID-era rules will be rolled back, while others may become permanent.
    • People with Long COVID will be further left behind, as the PHE’s end leads many people to distance themselves even more from the pandemic—even though long-haulers desperately need support. This will also affect people who are at high risk for COVID-19 and continue to take safety precautions.
    • Pandemic research and response efforts may be neglected. Lee referenced the “panic and neglect” cycle for public health funding: a pattern in which governments provide resources when a crisis happens, but then fail to follow through during less dire periods. The PHE’s end will likely lead us (further) into the “neglect” part of this cycle.

    How will COVID-19 data reporting change?

    The CDC published two reports this week that summarize how national COVID-19 data reporting will change after May 11. One goes over the surveillance systems that the CDC will use after the PHE ends, while the other discusses how different COVID-19 metrics correlate with each other.

    A lot of the information isn’t new, such as the phasing out of Community Level metrics for counties (which I covered last week). But it’s helpful to have all the details in one place. Here are a few things that stuck out to me:

    • Hospital admissions will be the CDC’s primary metric for tracking trends in COVID-19 spread rather than cases. While more reliable than case counts, hospitalizations are a lagging metric—it takes typically days (or weeks) after infections go up for the increase to show up at hospitals, since people don’t seek medical care immediately. The CDC will recieve reports from hospitals at a weekly cadence, rather than daily, after May 11, likely increasing this lag and making it harder for health officials to spot new surges.
    • National case counts will no longer be available as PCR labs will no longer be required to report their data to the CDC. PCR test totals and test positivity rates will also disappear for the same reason, as will the Community Levels that were determined partially by cases. The CDC will also stop reporting real(ish)-time counts of COVID-associated deaths, relying instead on death certificates.
    • Deaths will be the primary metric for tracking how hard COVID-19 is hitting the U.S. The CDC will get this information from death certificates via the National Vital Statistics System. While deaths are reported with a significant lag (at least two weeks), the agency has made a lot of progress on modernizing this reporting system during the pandemic. (See this December 2021 post for more details.)
    • The CDC will utilize sentinel networks and electronic health records to gain more information about COVID-19 spread. This includes the National Respiratory and Enteric Virus Surveillance System, a network of about 450 laboratories that submit testing data to the CDC (previously established for other endemic diseases like RSV and norovirus). It also includes the National Syndromic Surveillance Program, a network of 6,300 hospitals that submit patient data to the agency.
    • Variant surveillance will continue, using a combination of PCR samples and wastewater data. The CDC’s access to PCR swab samples will be seriously diminished after May 11, so it will have to work with public health labs to develop national estimates from the available samples. Wastewater will help fill in these gaps; a few wastewater testing sites already send the CDC variant data. And the CDC will continue offering tests to international travelers entering the country, for a window into global variant patterns.
    • The CDC will continue tracking vaccinations, vaccine effectiveness, and vaccine safety. Vaccinations are generally tracked at the state level (every state health agency, and several large cities, have their own immunization data systems), but state agencies have established data sharing agreements with the CDC that are set to continue past May 11. The CDC will keep using its established systems for evaluating how well the vaccines work and tracking potential safety issues as well.
    • Long COVID notably is not mentioned in the CDC’s reports. The agency hasn’t put much focus on tracking long-term symptoms during the first three years of the pandemic, and it appears this will continue—even though Long COVID is a severe outcome of COVID-19, just like hospitalization or death. A lack of focus on tracking Long COVID will make it easier for the CDC and other institutions to keep minimizing this condition.

    On May 11, the CDC plans to relaunch its COVID-19 tracker to incorporate all of these changes. The MMWR on surveillance changes includes a list of major pages that will shift or be discontinued at this time.

    Overall, the CDC will start tracking COVID-19 similar to the way it tracks other endemic diseases. Rather than attempting to count every case, it will focus on certain severe outcomes (i.e., hospitalizations and deaths) and extrapolate national patterns from a subset of healthcare facilities with easier-to-manage data practices. The main exception, I think, will be a focus on tracking potential new variants, since the coronavirus is mutating faster and more aggressively than other viruses like the flu.

    What should I do to prepare for May 11?

    If you’ve read this far, you’re probably concerned about how all these shifts will impact your ability to stay safe from COVID-19. Unfortunately, the CDC, like many other public agencies, is basically leaving Americans to fend for themselves with relatively little information or guidance.

    But a lot of information sources (like this publication) are going to continue. Here are a few things I recommend doing this week as the PHE ends:

    • Look at your state and local public health agencies to see how they’re responding to the federal shift. Some COVID-19 dashboards are getting discontinued, but many are sticking around; your local agency will likely have information that’s more tailored to you than what the CDC can offer.
    • Find your nearest wastewater data source. With case counts basically going away, wastewater surveillance will be our best source for early warnings about surges. You can check the COVID-19 Data Dispatch list of wastewater dashboards and/or the COVIDPoops dashboard for sources near you.
    • Stock up on at-home tests and masks. This is your last week to order free at-home/rapid tests from your insurance company if you have private insurance. It’s also a good time to buy tests and masks; many distributors are having sales right now.
    • Figure out where you might get a PCR test and/or Paxlovid if needed. These services will be harder to access after May 11; if you do some logistical legwork now, you may be more prepared for when you or someone close to you gets sick. The People’s CDC has some information and links about this.
    • Contact your insurance company to find out how their COVID-19 coverage policies are changing, if you have private insurance. Folks on Medicare and Medicaid: this Kaiser Family Foundation article has more details about changes for you.
    • Ask people in your community how you can help. This is a confusing and isolating time for many Americans, especially people at higher risk for COVID-19. Reaching out to others and offering some info or resources (maybe even sharing this post!) could potentially go a long way.

    That was a lot of information packed into one post. If you have questions about the ending PHE (or if I missed any important details), please email me or leave a comment below—and I’ll try to answer in next week’s issue.

    More about federal data

  • CDC shifts away from COVID-19 Community Levels with the federal emergency’s end

    CDC shifts away from COVID-19 Community Levels with the federal emergency’s end

    The CDC’s Community Levels suggest (perhaps inaccurately!) that the U.S. has little to worry about from COVID-19 right now. The agency is set to stop calculating these metrics next month.

    As we’ve gotten closer to May 11, the official ending of the federal public health emergency for COVID-19, I’ve tried to collect news on how this change will impact COVID-19 data availability. We know, for example, that the CDC will lose some of its authority to collect data from state and local health agencies, and that PCR testing numbers will become even less accurate.

    This week, another key change became public: the CDC will stop reporting COVID-19 Community Levels, according to reporting by Brenda Goodman at CNN. The agency is overall planning to shift from using case data to hospitalizations and wastewater surveillance.

    The CDC’s Community Levels are county-level metrics based on cases and hospitalizations. In February 2022, the agency switched to these metrics from its prior Transmission Levels (which were based on cases and test positivity), and essentially changed its national COVID-19 map from bright red to pastel green-yellow-orange overnight.

    Community Levels have generally made the U.S.’s COVID-19 situation look better than it really is over the last year, since these metrics relied on hospitalizations, a lagging indicator, and were set to high thresholds for recommending safety measures. Even so, the metrics gave Americans an easy way to look at the COVID-19 situation in their county or region.

    On May 11, that county-level information will no longer be available, according to Goodman’s reporting. When the public health emergency ends, the CDC will no longer be able to require COVID-19 testing labs to report their results—so this already-spotty information will become even less accurate. While test results at the national level might still be helpful for following general trends, it will be harder to interpret more local data.

    “We’re not going to lose complete surveillance, but we will lose that hyperlocal sensitivity to it perhaps,” an anonymous source at the CDC told Goodman. These more local metrics “simply cannot be sustained” due to reporting changes, the source said.

    In absence of county-level case data, the CDC plans on utilizing hospitalizations and wastewater surveillance to track COVID-19, according to the CNN report. The agency might focus on tracking COVID-19 at specific healthcare settings in a reporting network, similar to its surveillance for endemic diseases like flu and RSV, rather than trying to count every single severe COVID-19 case.

    Hospitalization data tend to lag behind cases, so wastewater surveillance will be important to provide early warnings about potential new coronavirus variants or surges. However, the country’s wastewater surveillance network is still patchy: some states have a sewage testing site in every county, while others only have a handful. Our data will be biased, based on which health departments have invested in this technology.

    It’s unsurprising to see the CDC plan this COVID-19 reporting change, given the powers it will lose on May 11. But I’m still disappointed. I’ve followed the U.S.’s incomplete surveillance for endemic diseases, and I hoped that continued COVID-19 tracking would provide an opportunity for improvement. Instead, it looks like we’re going to revert to something like our flu tracking, with wastewater surveillance unevenly tacked on.

    The May 11 changes will inevitably have a huge impact on the Americans who are still trying to stay safe from COVID-19, especially those with health conditions that make them more vulnerable to severe symptoms. Without reliable data, people will be unable to identify when spread is high or low in their community. I expect some will simply shrug off the risks (but may regret that choice later), while others will anticipate that COVID-19 is everywhere, all the time, and retreat from public activities.

    And from the public health perspective, less data will make it harder to identify concerning new variants or potential surges. For more on these challenges, I recommend this article by KFF Health News reporter Sam Whitehead, published in CNN and other outlets.

    “We’re all less safe when there’s not the national amassing of this information in a timely and coherent way,” Anne Schuchat, former principal deputy director of the Centers for Disease Control and Prevention, told Whitehead.

    More on federal data

  • Sources and updates, April 2

    • CDC publishes list of archived data pages: As the CDC prepares to shift its COVID-19 data publication efforts when the federal public health emergency ends in May, the agency has published a list of COVID-19 data and visualization pages that are no longer receiving updates. These archived pages include vaccination demographics, COVID-19 outcomes among pregnant people, data from correctional facilities, and more. I expect the list will get longer as we approach May 11, though the CDC is still updating core COVID-19 metrics (like cases, deaths, wastewater surveillance, etc.).
    • One federal COVID-19 emergency may end sooner: Speaking of ending emergencies: you might have seen some news this week about a Republican bill to end COVID-19’s emergency status, which President Biden has announced he would not veto if it comes to his desk. It’s important to note that this is actually a different emergency declaration than the public health one, which is under the control of the federal Department of Health and Human Services (HHS). The public health emergency is still slated to end on May 11, and its implications for COVID-19 tests, treatments, and vaccines have not changed. Also, related: this story in STAT explains the federal funding that’s currently left over for COVID-19 response.
    • Firearm injuries rose during COVID-19: A new report from the CDC shows how emergency department visits due to firearms rose during the pandemic. Compared to a 2019 baseline, these vitis were 37% higher in 2020, 36% higher in 2021, and 20% higher in 2022, the researchers found. Firearm injuries and deaths are another example of how COVID-19 contributed to higher excess morbidity and mortality; while these injuries weren’t directly caused by the coronavirus, they may be connected to the social and economic unrest that the U.S. faced over the last three years.
    • County Health Rankings 2023: This week, the County Health Rankings initiative at the University of Wisconsin Population Health Institute released its 2023 data. These rankings cover a wide array of health-related metrics, from health behaviors like alcohol and drug use to physical environment factors like air quality. The database may be a helpful resource for reporters or researchers looking to understand how their communities compare to others, while the organization’s 2023 report offers national health trends.
    • Global health workforce statistics: This database from the World Health Organization details how many health workers are employed around the world and over time. Statistics cover a variety of different health professions (doctors, specialists, nurses, dentists, pharmacists, etc.) and up to 20 years of data, depending on the country. While the dataset doesn’t cover through the pandemic—2020 is the most recent year included —it still shows how health workers have declined in many places over the last couple of decades. (H/t Data Is Plural.)
    • Public health worker declines: Speaking of health workers: a new study, published in the journal Health Affairs, shows how the public health workforce in the U.S. has severely declined during the pandemic. The researchers used data from a workforce survey conducted in 2017 and 2021, comparing past “intent to leave or retire” with actual rates of workers leaving. Nearly half of the state and local public health workers in the survey sample left between 2017 and 2021, the researchers found. This paper shows how recruitment and retention among health workers drastically needs improvement.

  • COVID-19 dashboards that haven’t shut down yet

    COVID-19 dashboards that haven’t shut down yet

    The Health Equity Tracker, run by the Morehouse School of Medicine’s Satcher Health Leadership Institute, is one of a few COVID-19 dashboards that is not shutting down at this time.

    We are in an era of dashboard shutdowns. Government agencies, research groups, and media organizations alike are winding down their COVID-19 reporting efforts. Some of these changes are directly tied to the end of the federal public health emergency in May, while others are more broadly attributed to shifting resources.

    In the last couple of weeks alone: the Johns Hopkins COVID-19 dashboard stopped collecting new data, the New York Times switched its COVID-19 tracker to show CDC data instead of compiling original information from states and counties, and the CDC itself announced that its COVID-19 data newsletter will end in May. The White House COVID-19 team will also be disbanded in May, according to reporting from the Washington Post.

    I haven’t done a comprehensive review of state and local COVID-19 dashboards, but I’m sure many of those are similarly shutting down, reporting less frequently, and reducing the types of data that they offer to the public. This is a trend I’ve been following since early last year, when state health departments started to declare COVID-19 was now “endemic” and didn’t require special monitoring resources, PCR testing infrastructure, etc. But it’s been accelerating in recent weeks, following the White House announcement about the end of the federal emergency.

    When explaining why their COVID-19 reporting efforts are ending, organizations often state that the disease is “no longer a major threat” or say that public interest in tracking COVID-19 has waned. I’m skeptical about both of those claims. First of all, we know that COVID-19 is still killing hundreds of Americans each week, with a majority of those being people who have had multiple vaccine doses. And we know that millions are facing activity limitations from Long COVID. As I wrote last month, the U.S. didn’t have a “mild” winter this year; we’re just getting better at ignoring COVID-19’s continued impacts.

    And second of all, I know there’s still an audience for this work—including many of the people who remain most vulnerable to COVID-19. Thank you to everyone who regularly reads this newsletter and blog, sends me questions, shares my work on social media, etc. for constantly validating that the interest is still here.

    With all of you great readers in mind, I’ve compiled this list of COVID-19 dashboards that I know haven’t yet shut down. The list is focused on national sources rather than state/local or international ones, in the interest of being most helpful to the majority of readers.

    • CDC COVID Data Tracker: The CDC’s COVID-19 dashboard is, of course, the primary source for federal data at this point in the pandemic. It provides weekly updates for most metrics (cases, hospitalizations, deaths, vaccinations, variant estimates, etc.); wastewater surveillance data are updated daily, with individual testing sites reporting on different cadences (usually about twice per week).
      Post-PHE update: Still active, but greatly changed. Cases and testing metrics are no longer available (with testing labs and state/local health agencies no longer required to report to the CDC), while other key metrics are updated less frequently or with more of a delay. See this post for more details.
    • Census Household Pulse Survey: Since early in the pandemic, the U.S. Census’ Household Pulse Survey has provided data on how COVID-19 impacted Americans’ day-to-day lives. This survey’s most recent iteration is scheduled for March through May 2023. The Census collaborates with other federal agencies on its surveys, including the CDC for Long COVID questions.
      Post-PHE update: The Pulse survey is typically conducted in two-month installments, with several weeks between each installment to adjust questions and process data. Its most recent installment ended in early May, and the next one has yet to be announced; we should know within the next month whether this data source is ending with the PHE or if it will continue.
    • Morehouse Health Equity Tracker: This project, from the Satcher Health Leadership Institute at the Morehouse School of Medicine, tracks COVID-19 metrics and a variety of other health conditions by race and ethnicity. The COVID-19 data are based on a CDC restricted access dataset; updates will continue “for as long as the CDC gives us data,” software engineer Josh Zarrabi said on Twitter this week.
      Post-PHE update: For COVID-19 data, this tracker utilizes a CDC dataset of cases with detailed demographic information, compiled from case reports sent to the CDC by state health agencies. The CDC dataset was last updated in April 2023, and it’s unclear whether it’ll be updated again (but my guess is it’ll end with the PHE). The Morehouse tracker includes plenty of other health metrics, though, so I expect this dashboard will be able to adjust to the CDC change.
    • APM Research Lab: This research organization, run by American Public Media, has several ongoing COVID-19 trackers. These include COVID-19 deaths by race and ethnicity (national and by state), vaccination rates (national and by state), and Minnesota-specific data, in collaboration with Minnesota Public Radio.
      Post-PHE update: APM is continuing to update its tracker; the most recent update to its COVID-19 deaths by race and ethnicity page occurred on May 17. Its staff will likely need to make some changes to their underlying data sources, since the CDC is now reporting COVID-19 deaths differently, but the basic metrics remain available.
    • Walgreens COVID-19 Index: Walgreens shares data from COVID-19 tests conducted at over 5,000 pharmacy locations nationwide. The tracker includes test positivity (national trends and state-by-state), variant prevalence, and positivity by vaccination status.
      Post-PHE update: Still active, with no change due to the PHE’s end.
    • COVIDcast by CMU Delphi: COVIDcast is a COVID-19 monitoring project by the Delphi Group at Carnegie Mellon University. The dashboard pulls in COVID-19 data from the CDC and other sources, such as Google search trends and antigen test positivity.
      Post-PHE update: No longer includes cases and deaths (which were pulled from the CDC), but still updating other metrics, including hospital admissions, symptom searches from Google trends, and COVID-related doctor visits.
    • Iowa COVID-19 Tracker: Despite its name, the Iowa COVID-19 Tracker displays data from across the country, sourced from the CDC. It’s run by Sara Anne Willette, a data expert based in Ames, Iowa. Willette frequently shares data updates on social media and streams on Twitch when updating her dashboard.
      Post-PHE update: Still active, but with some changes due to the new limitations in CDC data. Dashboard manager Sara Anne Willette shares frequent updates on Twitter about what she’s changing and why.
    • COVID-19 dashboard by Jason Salemi: This dashboard by University of South Florida epidemiologist Jason Salemi is another page displaying CDC data in somewhat-more-user-friendly visualizations. The dashboard is focused on Florida, but shares national state- and county-level data.
      Post-PHE update: Salemi shared on Twitter last week that he is currently assessing whether to keep the dashboard running or decomission the site.
    • Biobot Analytics: Biobot Analytics is the leading wastewater surveillance company in the U.S., tracking COVID-19 at hundreds of sewershed sites through its partnership with the CDC National Wastewater Surveillance System and independent Biobot Network. The dashboard has helpful national- and regional-level charts along with county-level data for sites in Biobot’s network.
      Post-PHE update: Still active, no changes due to the PHE’s end. In fact, Biobot continues to add more wastewater testing sites to its network.
    • WastewaterSCAN: WastewaterSCAN is another leading wastewater project, led by professors at Stanford and Emory Universities. The project started with sites in California, but has since expanded nationwide; it’s tracking several other common viruses in addition to COVID-19.
      Post-PHE update: Still active, similarly to Biobot’s dashboard.
    • For more wastewater data: Check out the COVID-19 Data Dispatch resource page with annotations on state and local dashboards.
    • KFF COVID-19 Vaccine Monitor: Since late 2020, the Kaiser Family Foundation has monitored American attitudes around COVID-19 vaccines and other pandemic issues. Updates were initially released monthly, but have become less frequent in the last year (the latest update was published on February 7, 2023).
      Post-PHE update: This KFF project appears to be ongoing, but at a lower frequency of updates; the most recent update is still February 2023. A newer KFF dashboard (tracking Medicaid enrollment and unwinding) is also receiving ongoing updates.
    • Axios-Ipsos COVID-19 polls: Axios has partnered with the polling firm Ipsos on regular polls tracking COVID-19 views and behaviors. The polling data are available in PDF reports and in spreadsheets from Roper. In 2023, Axios and Ipsos shifted their focus from COVID-19 to broader questions about public health, with a new series of quarterly polls.
      Post-PHE update: These two organizations will continue their new series of quarterly polls about public health, launched in early 2023. The most recent installment was posted this past week and includes questions about the PHE’s end, gun violence, opioids, and more.

    Have I missed any major data sources? Send me an email or comment below to let me know, and I’ll highlight it in a future issue.

    Editor’s note, April 2, 2023: This post has been updated with two additional dashboards (APM Research Lab and Walgreens), and additional information on the CDC’s wastewater surveillance dashboard.

    Editor’s note, May 21, 2023: This post has been updated with notes about changes impacting these dashboards due to the end of the federal public health emergency (PHE).

    More federal data

  • COVID source callout: CDC ends its data newsletter

    This past Friday, the CDC’s COVID-19 data team announced that its newsletter, the COVID Data Tracker Weekly Review, will send its final issue on Friday, May 12. That’s the day after the federal public health emergency for COVID-19 ends.

    For the last two years, the Weekly Review newsletter has been a great source of accessible updates on the state of COVID-19 in the U.S.; it includes summary statistics on cases, hospitalizations, vaccinations, variants, wastewater surveillance, and deaths. I’ve frequently referenced the newsletter in my own National Numbers updates, and have pointed other journalists to it.

    But this newsletter hasn’t been as reliable as one might expect from the CDC. Its writers have frequently taken the week off for federal holidays, even when the holiday falls on a Monday—and the newsletter is sent on Fridays. In recent months, the CDC has only compiled this newsletter every other week, making the “weekly review” title a misnomer. And now, the CDC has announced there will be only three more issues: sent on March 31, April 14, and May 12. (Seems like the newsletter is briefly shifting to a monthly schedule before it ends?)

    While the CDC will continue to regularly update its main COVID-19 dashboard and other data sources, the agency’s failure to maintain even a fairly basic update newsletter really speaks to its deprioritization of COVID-19. It honestly boggles the mind that I, a freelance journalist writing about COVID-19 data in her spare time, send updates with more continuity than the entire national public health agency.

    Yet somehow, here we are! This newsletter may see continued shifts to its format, but it isn’t going anywhere.

  • COVID-19 is inspiring improvements to surveillance for other common viruses

    COVID-19 is inspiring improvements to surveillance for other common viruses

    The CDC provides norovirus test positivity data from a select number of labs that report test results for this virus. Due to limited reporting, data are only available at the regional level.

    This week, I have a new story out in Gothamist and WNYC (New York City’s public radio station) about norovirus, a nasty stomach bug that appears to be spreading a lot in the U.S. right now. The story shares some NYC-specific norovirus information, but it also talks more broadly about why it’s difficult to find precise data on this virus despite its major implications for public health.

    Reporting this story led me to reflect on how COVID-19 has revealed cracks in the country’s infrastructure for tracking a lot of common pathogens. I’ve written previously about how the U.S. public health system monitored COVID-19 more comprehensively than any other disease in history; the scale of testing, contact tracing, and innovation into new surveillance technologies went far beyond the previous standards. Now, people who’ve gotten used to detailed data on COVID-19 have been surprised to find out that such data aren’t available for other common pathogens, like the flu or norovirus.

    It might feel disappointing to realize how little we actually know about the impacts of endemic diseases. But I choose to see this as an opportunity: as COVID-19 revealed gaps in public health surveillance, it inspired development in potential avenues to close those gaps. Wastewater surveillance is one big example, along with the rise of at-home tests and self-reporting mechanisms, better connectivity between health systems, mobility data, exposure notifications, and more.

    Norovirus is a good example of this trend. Here are a few main findings from my story:

    • Norovirus is a leading cause of gastrointestinal disease in the U.S., and is estimated to cause billions of dollars in healthcare and indirect societal costs every year.
    • People who become infected with norovirus are often hesitant to seek medical care, because the symptoms are disgusting and embarrassing. Think projectile vomit, paired with intense diarrhea.
    • Even when patients do seek medical care, norovirus tests are not widely available, and there isn’t a ton of incentive for doctors to ask for them. Testing usually requires a stool sample, which patients are often hesitant to do, one expert told me.
    • The virus is not a “reportable illness” for the CDC, meaning that health agencies and individual doctors aren’t required to report norovirus cases to a national monitoring system. (So even when a patient tests positive for norovirus, that result might not actually go to a health agency.)
    • The CDC does require health agencies and providers to report norovirus outbreaks (i.e. two or more cases from the same source), but national outbreak estimates are considered to be a vast undercount of true numbers.
    • Even in NYC, where the city’s health agency does require reporting of norovirus cases, there’s no recent public data from test results or outbreaks. (The latest data is from 2020.)

    As I explained in an interview for WNYC’s All Things Considered, the lack of a national reporting requirement and other challenges with tracking norovirus are linked:

    It seems like the lack of a requirement and the difficulty of tracking kind-of play into each other, where it’s not required because it’s hard to track—but it’s also hard to track because it’s not required.

    The lack of detailed data on pathogens like norovirus can be frustrating on an individual level, for health-conscious people who might want to know what’s spreading in their community so that they can take appropriate precautions. (For norovirus, precautions primarily include rigorous handwashing—hand sanitizer doesn’t work against it—along with cleaning surfaces and care around food.)

    These data gaps can also be a challenge for public officials, as more detailed information about where exactly a virus is spreading or who’s getting sick could inform specific public health responses. For example, if the NYC health department knew which neighborhoods were seeing the most norovirus, they could direct handwashing PSAs to those areas. In addition, scientists who are developing norovirus vaccines could use better data to estimate the value of those products, and determine who would most benefit.

    So, how do we improve surveillance for norovirus and other viruses like it? Here are a few options I found in my reporting:

    • Wastewater surveillance, of course. The WastewaterSCAN project is already tracking norovirus along with coronavirus and several other common viruses; its data from this winter has aligned with other sources showing a national norovirus surge, one of the project’s principal investigators told me.
    • Better surveillance based on people’s symptoms. The Kinsa HealthWeather project offers one example; it aggregates anonymous information from smart thermometers and a symptom-tracking app to provide detailed data on respiratory illnesses and stomach bugs.
    • At-home tests, if they’re paired with a mechanism for people to report their results to a local public health agency. Even without a reporting mechanism, at-home tests could help curb outbreaks by helping people recognize their illness when they might be asymptomatic.
    • Simply increasing awareness and access to the tests that we already have. If more people go to the doctor for gastrointestinal symptoms and more doctors test for norovirus, our existing data would get more comprehensive.

    Are there other options I’ve missed? Is there another pathogen that might be a good example of common surveillance issues? Reach out and let me know.

  • National numbers, February 26

    National numbers, February 26

    According to the CDC’s data on hospital emergency department visits for respiratory viruses, COVID-19 visits have plateaued while flu and RSV have returned to low levels.

    In the past week (February 16 through 22), the U.S. officially reported about 240,000 new COVID-19 cases, according to the CDC. This amounts to:

    • An average of 34,000 new cases each day
    • 72 total new cases for every 100,000 Americans
    • 9% fewer new cases than last week (February 9-15)

    In the past week, the U.S. also reported about 25,000 new COVID-19 patients admitted to hospitals. This amounts to:

    • An average of 3,500 new admissions each day
    • 7.5 total admissions for every 100,000 Americans
    • 5% fewer new admissions than last week

    Additionally, the U.S. reported:

    • 2,400 new COVID-19 deaths (350 per day)
    • 85% of new cases are caused by Omicron XBB.1.5; 12% by BQ.1 and BQ.1.1; 1% by CH.1.1 (as of February 25)
    • An average of 60,000 vaccinations per day

    The national COVID-19 plateau continues. As I’ve been saying for a few weeks now, COVID-19 spread has dropped significantly from its high during the winter holidays, but it has not fallen to the low levels we’ve previously seen this time of year due to a combination of lax precautions and the latest Omicron variant, XBB.1.5.

    Case and hospitalization data from the CDC, along with wastewater surveillance data, all show COVID-19 spread declining—but very slowly. Cases declined by 9% this week compared to the week prior, while new hospital admissions declined by 5%. Biobot’s wastewater surveillance dashboard shows slight declines or plateaus in all four major regions of the country.

    Respiratory virus season is clearly waning in the U.S., according to hospital emergency room visit data from the CDC’s National Syndromic Surveillance Program. ER visits for the flu and RSV have pretty much returned to baseline after their winter peaks. But COVID-19 ER visits have plateaued at a higher level, close to the visit numbers reported in September and October—another sign of the elevated “low tide” we’ve now been dealing with since spring 2022.

    On the variant front: Omicron XBB.1.5 continues to dominate in the U.S. It caused an estimated 85% of new cases nationwide in the week ending February 25, according to the CDC, and is the main variant circulating in every region. After several months of “variant soup” with a number of Omicron subvariants competing, XBB.1.5 has emerged as the clear victor; no other single lineage is causing more than 10% of new cases in the country, per the CDC’s estimates.

    I continue to write about COVID-19 case numbers from the CDC here, mostly because A) the directional patterns (i.e. upticks and downturns) of these data are still a decent representation of actual directional patterns in infections, and B) the CDC’s case numbers are more nationally representative (when it comes to geography) than data from the National Wastewater Surveillance System.

    But I have to stress that these case numbers are increasingly undercounting actual infections. The last decent estimates I’ve seen comparing cases to infections, dated from last fall, suggested that case numbers are undercounted by a factor of 10 to 20. These days, I expect we’re likely closer to a factor of 20, if not higher. As evidence, test positivity for the entire U.S. has been at 10% for a couple of weeks now.

    Other evidence for this continued undercounting comes from wastewater data. From resources like the Biobot dashboard, which compares wastewater surveillance trends to case trends, it’s abundantly clear that these two metrics used to align closely—but now coronavirus levels in wastewater are consistently much higher. In New York City, for example, wastewater data show that the city experienced one of its greatest COVID-19 surges this winter.

    Speaking of unreliable numbers: the team behind the CDC’s COVID Data Tracker Weekly Review has begun to update its readers on how the end of the federal public health emergency will impact COVID-19 data. The first update, published on Friday, explains that some data, including hospitalization and vaccination numbers, “may be reported less frequently” or with new gaps. I anticipate we’ll get more details about this in the coming weeks, as the CDC negotiates new data-sharing requirements with other health agencies.

    The CDC’s data tracking newsletter is also shifting from a weekly newsletter to biweekly, starting March 3. It continues to boggle my mind how I, a single freelance journalist writing this publication in my spare time, am able to keep up more regular data updates than a massive federal agency.

  • This winter’s COVID-19 surge wasn’t “mild”

    This winter’s COVID-19 surge wasn’t “mild”

    Wastewater surveillance data from Biobot suggests that COVID-19 spread this winter (2022-2023) was higher than all other surges prior to Omicron’s emergence.

    You might have seen some headlines like this in the last few weeks: COVID-19 was “mild” this winter. This winter was “better” than previous winters. COVID-19 is becoming “another seasonal virus” like flu and RSV. But is this true?

    While it’s accurate that the U.S. reported fewer COVID-19 cases this past winter compared to last year (when the country experienced our first, massive Omicron surge) or the prior year (our biggest surge pre-vaccines), this winter still saw an extraordinary amount of severe illness, death, and potential future disability due to COVID-19. Surges of other respiratory viruses also put enormous strain on the healthcare system.

    If we call this winter “mild,” we run the risk of believing this level of disease is acceptable. Such portrayals of COVID-19 seek to make us think future surges will be nothing to worry about, despite clear evidence to the contrary.

    Let’s go through some numbers. Since the beginning of November, the U.S. has reported:

    • More than 5 million new COVID-19 cases (reported). Note that cases are likely underreported by 10 to 20 times in our era of under-testing, so the true number may be closer to 100 million.
    • More than 400,000 new COVID-19 hospitalizations, piling on top of hospitalizations for the flu, RSV, and other diseases, and coming as hospitals deal with staff shortages and worker burnout.
    • More than 40,000 new COVID-19 deaths, amounting to more than 400 new deaths per day. This number is also likely an undercount, as death certificates can take a long time to be processed.
    • The majority of COVID-19 deaths were among vaccinated people. A report from the Kaiser Family Foundation found that breakthrough deaths started to outnumber those among unvaccinated people in summer 2022, a trend that has continued with low booster uptake.
    • Coronavirus levels in wastewater were higher than all surges prior to Omicron, including the winter surge in 2020-2021 and the Delta surge in summer 2021, according to data from Biobot.
    • XBB.1.5, the latest and most contagious Omicron subvariant, evolved in the U.S. this winter, likely in New York State. Unchecked COVID-19 spread makes it easier for the virus to keep mutating.
    • More than 5% of American adults are currently experiencing Long COVID. This number has ranged from 5.5% to 7% since September 2022, according to the CDC and Census’ Household Pulse Survey.
    • Almost 80% of adults with Long COVID report activity limitations due to the condition, including about 25% who report “significant” activity limitations, per the Household Pulse Survey.

    In an average week this winter, the U.S. reported more deaths from COVID-19 than the number of casualties on September 11, 2001. The latter event was a horrific tragedy that inspired lasting changes to national security, while the former has been written off as “mild.”

    Past surveys from many sources—including the CDC itself—have suggested that, when people know COVID-19 is spreading widely in their communities, they’re willing to take basic safety precautions. But when government leaders and mainstream media outlets downplay the risks, people don’t have the information they need to make informed choices. We’ve seen this pattern at a large scale this winter, and I worry that the trend will only continue.

    And here’s what concerns me even more: in previous winters, cases went up over the holidays, then declined through January and February. This year, however, the decline isn’t really happening. Transmission has gone down a bit from its peak, but it’s now plateaued at a level higher than the peaks of previous surges, per Biobot’s data.

    So, not only did we have a bad surge this winter, we’re now stuck at a high-COVID baseline that seems very difficult to shake, in the era of many new variants and few public health precautions. The situation reminds me of a Twitter thread from the evolutionary biologist T. Ryan Gregory, which I shared when writing about XBB.1.5 in early January:

    That “area under the curve” is what the U.S. is seeing now, as COVID-19 spread stays at high levels. Thousands of cases a day, thousands of hospitalizations a day, hundreds of deaths a day.

    As a journalist and as an individual capable of taking precautions, I resist the narrative that any of this is acceptable. If you’re reading this, I hope you can, too.

    More federal data

  • What the public health emergency’s end means for COVID-19 data

    This past Monday, the White House announced that the federal public health emergency for COVID-19 will end in May. While this decision might be an accurate reflection of how most of the U.S. is treating COVID-19 right now, it has massive implications for Americans’ access to tests, treatments, vaccines—and data.

    I wrote about the potential data issues last September, in anticipation of this emergency ending. Here are the highlights from that post:

    • Outside of a public health emergency, the CDC has limited authority to collect data from state and local health agencies. And even during the emergency, the CDC’s authority has been minimal enough that national datasets for some key COVID-19 metrics (like breakthrough cases and wastewater surveillance) have been very spotty.
    • When the federal emergency ends, the Department of Health and Human Services (HHS) may lose its ability to require reporting of some key data, including: PCR test results (from states), hospital capacity information and COVID-19 patient numbers (from individual hospitals), COVID-19 cases and deaths in nursing homes.
    • It’s possible that the HHS and/or CDC will negotiate new data reporting requirements with states and other entities that don’t rely on the public health emergency. They have about three months to do this. I haven’t seen much news on that yet, but I’ll keep an eye out and share updates as I find them.
    • Regardless, I expect that reporting COVID-19 numbers to federal data systems will become even more voluntary than it already is for health agencies, hospitals, congregate facilities, and other settings. We will likely have to rely more on targeted surveillance systems (which compile data from a subset of healthcare facilities) rather than comprehensive national datasets, similar to our current surveillance systems for the flu and other endemic diseases.

    At the same time, the public health emergency’s end will lead to changes in the distribution of vaccines, tests, and treatments. The Kaiser Family Foundation has a helpful explanation of exactly what’s changing. Here are the highlights:

    • Vaccines will remain free to all as long as the stockpile of doses purchased by the federal government lasts. However, the ending emergency will likely impact the government’s ability to buy more vaccines—including future boosters that might be targeted to new variants. Vaccine manufacturers are planning to raise their prices, and cost will become a burden for uninsured and underinsured people.
    • At-home, rapid tests will no longer be covered by traditional Medicare, while Medicare Advantage coverage will vary by plan. Most private insurance providers will likely still cover the tests, but prices may go up (similarly to the prices for vaccines).
    • PCR tests are also likely no longer going to be covered by a lot of insurance plans and/or are going to get more expensive. Notably, Medicaid will continue covering both at-home and PCR tests through September 2024.
    • Treatments (primarily Paxlovid right now) will remain free for doses purchased by the federal government, similar to the situation with vaccines. After the federally-purchased supply runs out, however, we will similarly see rising costs and dwindling access.

    KFF also has produced a detailed report about how the end of the federal emergency will impact healthcare coverage more broadly.

    In short, the end of the public health emergency will make it harder for Americans to get tested, receive treatments, and stay up to date with COVID-19 vaccines. The testing access changes, in particular, will lead to official case numbers becoming even less accurate, as fewer people seek out tests. At the same time, Americans will lose access to the data we need to know how much of a threat COVID-19 presents in the first place.

    It’s also worth noting that, on the same day the White House announced the end of its emergency declaration, the World Health Organization announced the opposite: the global public health emergency is continuing, though it may end later in 2023. As Americans largely ignore COVID-19, millions of people around the world are unvaccinated, facing new surges, dealing with new variants, etc.

    COVID-19 clearly remains a looming threat at the global level. In the U.S., we technically have the best vaccines and treatments to deal with the disease—but these tools are going underutilized, and the Biden administration’s decision this week will only make it harder for people to get them. Maybe we shouldn’t have to rely on an emergency declaration to get basic data and access to health measures in the first place.

    More federal data