The COVID Racial Data Tracker, a collaboration between the COVID Tracking Project and the Boston University Center for Antiracist Research, collects COVID-19 race and ethnicity data from 49 states and the District of Columbia. We compile national statistics and compare how different populations are being impacted across the country.
But there are a lot of gaps in our dataset. We can only report what the states report, and many states have issues: for example, 93% of cases in Texas do not have any reported demographic information, and West Virginia has not reported deaths by race since May 20.
A new form on the COVID Tracking Project website allows you to help us advocate for better quality data. Simply select your state, then use the contact information and suggested script to get in touch with your governor. States with specific data issues (such as Texas and West Virginia) have customized scripts explaining those problems.
If you try this out for your state, please use the bottom of the form to let us know how it went!
The COVID Tracking Project published a blog post this week in which three of our resident Texas experts, Conor Kelly, Judith Oppenheim, and Pat Kelly, describe a dramatic shift in Texas testing numbers which has taken place in the past two weeks.
On August 2, the number of tests reported by Texas’s Department of State Health Services (DSHS) began to plummet. The state went from a reported 60,000 tests per day at the end of July to about half that number by August 12. Conor, Judith, and Pat explain that this overall drop coincides with a drop in tests that DSHS classifies as “pending assessment,” meaning they have not yet been assigned to a county. Total tests reported by individual Texas counties, meanwhile, have continued to rise.
Although about 85,000 “pending assessment” tests were logged on August 13 to fill Texas’s backlog, this number does not fully add up to the total drop. For full transparency in Texas, DSHS needs to explain exactly how they define “pending assessment” tests, how tests are reclassified from “pending” to being logged in a particular county, and, if tests are ever removed from the “pending” category without reclassification, when and why that happens. As I mentioned in last week’s issue, DSHS has been known to remove Texans with positive antigen tests from their case count; they could be similarly removing antigen and antibody tests reported by counties from their test count.
If you live in Texas, have friends and family there, or are simply interested in data issues in one of the country’s biggest outbreak states, I highly recommend giving the full post a read. For more Texas test reporting, check out recent articles from Politico and the Texas Tribune.
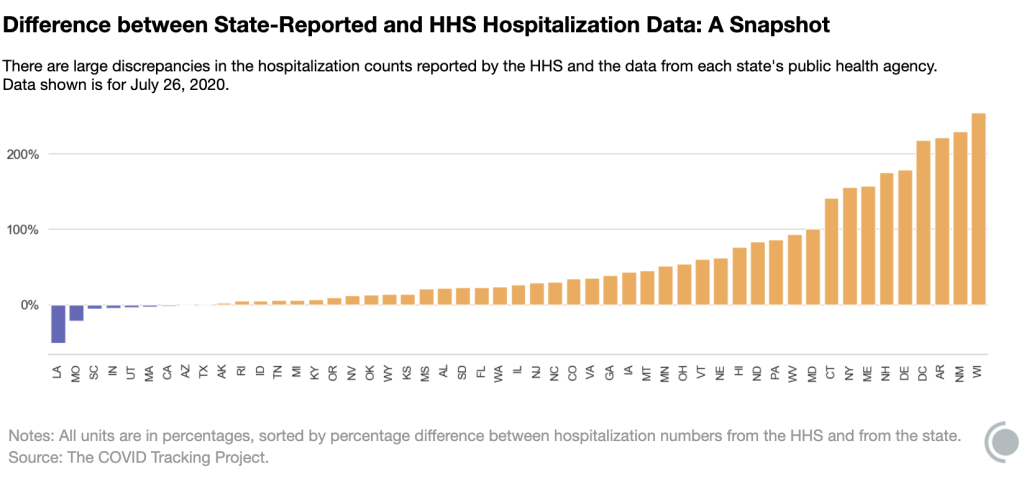
Last Tuesday, the post on COVID-19 hospitalization data that I cowrote with Rebecca Glassman was published on the COVID Tracking Project’s blog. We pointed out significant discrepancies between the Department of Health and Human Services (HHS)’s counts of currently hospitalized COVID-19 patients and counts from state public health departments. You can read the full post here, or check out the cliff notes in this thread:
so, @NotoriousRSG and I wrote a blog post for @COVID19Tracking about what's up with current hospitalization counts. there are two datasets, one (federal) from the HHS, and one (states) compiled by CTP. they differ wildly. thread! (1/11) https://t.co/i93nYflz0z
That same day, the Wall Street Journal published an article on HHS’s estimates of hospital capacity in every state—which, as you may recall from my first newsletter issue, have been plagued with delays and errors. These hospital capacity estimates are based on the raw counts that Rebecca and I analyzed. It appears that errors in hospital reprots are causing errors in HHS’s raw data, which in turn makes it more difficult for HHS analysts to estimate the burden COVID-19 is currently placing on healthcare systems. When the CDC ran this dataset, estimates were updated multiple times a week; now, under the HHS, they are only updated once a week.
On Wednesday, the New York Times reported that 34 current and former members of a federal health advisory committee had sent a letter opposing the move of hospital data from the CDC to the HHS. These medical and public health experts cited new burdens for hospitals and transparency concerns as issues for HHS’s new data collection system. (The New York Times article references Rebecca’s and my blog post, which is pretty cool.)
In an earlier issue, I reported that several congressmembers had opened an investigation into TeleTracking, the company HHS contracted to build its new data collection system. Well, the New York Times reported on Friday that TeleTracking is refusing to answer congressmembers’ questions because the company signed a nondisclosure agreement.
And finally, HHS chief information officer José Arrieta resigned on Friday. I’m tempted to hop on the next bus to Pittsburgh and start banging on the door of TeleTracking’s headquarters if we don’t get answers soon.
Five State Auditors were on the task force to develop a framework for evaluating state COVID-19 data. Screenshot of the auditing template provided by Delaware State Auditor Kathy McGuiness.
This past Monday, I had the pleasure of speaking to Delaware State Auditor Kathy McGuiness. Auditor McGuiness was elected to her position in 2018, and she hit the ground running by implementing new ways for Delaware residents to report fraud and keep track of how their taxpayer dollars were being spent.
Now, State Auditor McGuiness is focused on COVID-19. She spearheaded the creation of a standardized template that she and other state auditors will use to evaluate their states’ COVID-19 data collection and reporting. The template, created in collaboration with auditors from Florida, Mississippi, Ohio, and Pennsylvania, is a rubric which watchdog offices may use as a baseline in determining which datasets they examine and which questions they ask of state politicians and public health officials.
State Auditor McGuiness sent me a copy of this rubric; I’ll go over its strengths and drawbacks later in this issue. But first, here’s our conversation (lightly edited and condensed for clarity).
Interview
Betsy Ladyzhets: What is a State Auditor?
State Auditor Kathy McGuiness: We’re the ones looking for accountability and transparency, in regards to taxpayer dollars—to identify fraud, waste, and abuse.
BL: What does your job usually look like? Are you usually conducting investigations like this?
KM: We do investigations, we have the fraud hotline. We triage cases, we document, and then sometimes it leads to an investigation, sometimes it leads to a referral.
BL: What was the impetus for this investigation to look into COVID data collection? Was there a particular event that alerted you to the issue of COVID data across states?
KM: I noticed there were inconsistencies in it being reported nationwide. Everything from the case numbers, to tests being inaccurately counted. I noticed on several national calls that there were other states that were looking for similar bits of information… So who better to look at this information from an independent perspective than the other state fiscal watchdogs, right?
And every state has different rules. You have some [state auditors] that are chairing oversight committees, or other committees… You also have several states where they’re legislative auditors, they don’t necessarily do things like this. They might just take their audit plan every year from the direction of their general assembly. Half [the auditors] are elected in the country, and half are not. So I knew not everyone is going to be able to participate or even get the permission.
There’s a national group called NASACT—the National Association of State Auditors, Comptrollers and Treasurers. I went through their organization, pitched this idea of doing a national template, and asked them, let me do a survey first and see if there’s interest. By the next day, I had a couple of questions, they shot it out in a mass email. I had 29 states respond and 21 show interest immediately. That’s when I comprised the task force with Florida, Mississippi, Ohio, and Pennsylvania. A multi-state effort. Since then, other states have come on with interest, some wanting to be in the process, some not.
The whole idea was to focus on this collection, monitoring and reporting, for several reasons. Instead of several states maybe wasting their time and resources asking similar questions—we have one baseline where we’re all asking the same questions and trying to find out how our state has done. Down the line, we’ll be able to look at each other, and see how others did, and maybe there are areas of improvement where we can capture a process that we didn’t think of.
BL: You mentioned that in some states, the state auditor or a similar position to what you have, that position is elected, and in other places it’s appointed. Were there any auditors on the task force who faced pushback from other state leaders?
KM: No, not at all. I mean, there’s a couple [of auditors] who said, “I’d like to participate but I can’t, that’s not how my job works.” And I believe we had another legislative auditor say, “I still want to do this. I’m going to ask for permission, but I won’t be able to until my General Assembly goes back in session.” So, it’s all over the map.
BL: Yeah. I’m curious about Florida in particular because there’s been a lot of tension there. There’s Rebekah Jones, who was a whistleblower scientist who worked at Florida’s public health department, who said she was fired for refusing to manipulate their data.
KM: Wow.
BL: So I was very curious to see that state on the list.
KM: I didn’t know about this… I met their auditor, Sherrill Norman, at a NASACT conference. She came to mind especially, because when I put this together I was looking for diversity in the group. But also, who has a performance audit division? Not all states do… When you talk to me, we only have 27 employees, and when you talk to Pennsylvania and they have 400—they have more resources than I do, and I wanted to move this along in a timely manner. There was no politics in the reason [Florida] was picked, if that makes sense.
BL: Yeah, that makes sense. I guess I’ll have to watch and see if Florida publishes the results of their audit.
KM: They will. Or—they should. These [results] are going to be like any other report, or audit, or engagement, or examination, or inspection, or investigation. You make it public.
BL: Could you tell me a bit more about how the framework was developed, or what the collaboration was like between you and the other State Auditors who worked on this? Were there any specific topics that were focuses if you did research, or if you consulted experts, what was that process like?
KM: We had the experts—we had the lead performance audit teams. Our intent was, or is, that the states will be able to evaluate their own data. Then, if they so choose, compare with the other ones. But with these controls in place, this will paint a more accurate and conclusive picture, hopefully, with our efforts to combat this virus and control the spread.
BL: Are there particular goals in terms of say, looking at case data, or looking at deaths data, or anything else? Or are you broadly trying to figure out what will make it more accurate and more efficient?
KM: That’s exactly what we’re trying to do. That’s the whole intention here. Because things have been all over the map. And [the audit] just wants to accurately certify monitoring this data. It wants to be able to say, this is independent, we’re not political, we’re not driven by anything or anyone, and we’re all asking the same questions. Keeping in mind, not everyone’s going to be able to get to the answer.
BL: Right.
KM: Because sometimes [state auditors] have access to certain information, and sometimes they don’t.
BL: Is there an example of a piece of information where that differs, depending on how the state’s set up?
KM: Yes—one state might have a MOU, a memorandum of understanding, with an agency to be able to gather their data and look at it. I know New York[‘s auditor] can do that with the Medicaid data. They have constant access to it. There’s other [state auditors’ offices] that have to have agreements, there’s other states that don’t have access to certain data from their states. Every audit shop is different. [This framework] is just trying to give us something that we can all do together, and really be able to have a true comparison.
We’re gonna do the best we can, and obviously I’m going to report my data, put it out there. And say another state wants to compare against Delaware—well, they may not be able to on all points. It depends on what information is available, or granted.
BL: Right. So, I volunteer at the COVID Tracking Project, where we compile data from every state. And one major challenge we face is the huge differences in data definitions. Some states define their COVID case number as including confirmed and suspected cases, other states only include confirmed cases, some they don’t provide a definition at all. I’m curious about how the auditing framework addresses these kinds of different definitions.
KM: That’s one of the challenges. You’re faced with inconsistent data collection across all the public health departments, and that’s something we will review. We want to find out what is publicly available and what is not. And that also helps states compare with best practices. We’re just looking for a unified approach with the common metrics.
BL: Yeah. Ideally, every state would be using the same definition. But does every state have the data available to use the same definition? Some states just don’t track suspected cases.
KM: Correct. Well, I—they shall remain nameless, but they are participating, so you do want to watch this over the next few months. It was my understanding that one state isn’t even testing in nursing homes.
BL: Wow. I definitely will look out for that.
KM: Yeah. I was like, what? How do you do that? How is that possible? I’m not—making fun, I’m not poking blame. What I’m saying is, [we auditors want to look into] how each state reports their metrics and how they’re doing, so that we can determine best practices on our own.
BL: How does the auditing framework account for the fact that each state is facing different challenges because of its population or its geography? Like, I know Ohio has had major outbreaks in its prison populations, Florida had to shut down testing sites because of the hurricane recently. How is that accounted for in the fact that you’re trying to use the same framework in these different states?
KM: That’s a good question. I do know that one audit shop already spoke to going a little bit further. So, the auditing framework is flexible. We have our baseline, what we are all agreeing to ask. If they want to go further, they can.
Given the resource constraints of each auditor, we felt it was—we wanted to have something narrow enough that everyone could do in a timely fashion, and generic enough that everyone could do in a timely fashion. But if they wanted to go look further, they had the resources and time, it’s up to them.
BL: Do you have a prospective timeline for this? For Delaware specifically or in general, are there any requirements or timing goals?
KM: Yes. We have—obviously, like everyone else, we’re in the middle of several projects, many got held up… But this has become a priority. There’s a team assigned, and they are moving forward. We’re hoping that, in the next three months, we can have something.
I know that a couple of other states have moved forward with this, and some have not been able to even begin the process of initiating this audit. The times are going to vary depending on the audit shops, and their audit plans, and their resources. And when I say “audit plan”—you usually have our audit plan ready by the time your next fiscal year is starting.
BL: I see. Within three months, that’s pretty good for such a thorough project.
KM: It’s aggressive. But we’re ready! It’s about acquiring information.
BL: And how will the results of the audit impact the states that are evaluated? In Delaware, or if you have any indication of what might happen in other places.
KM: The hope is that this template and subsequent state reviews validate efforts and certify the integrity of the data. And when it doesn’t, that those shortcomings can be quickly remedied. Again, we’re looking towards the future. Looking towards best practices. And I think this initiative will help policy-makers and help public health officials to better prepare by giving power to the data and knowledge. Truth and transparency.
BL: Power to the data!
KM: That’s right.
BL: That’s what we want! We want consistency, trust.
KM: We do. And we need transparency and accountability. People say they want it, right? So we’re gonna give it to them. And some states may have recommended changes to data collection based upon these audit results.
The office I took over was more of a “gotcha” office. “Ah, I gotcha, look what you did wrong.” And that’s not where I’m coming from. I’m coming from, partnerships, and collaboration, and there’s always room to improve. I don’t think there’s any penalty here, if any states fare poorly. We will be able to compare and contrast, and look at best practices, but we can all do better and work together to implement best practices for other people.
Analysis
After our interview, I looked at the data audit template itself.
The template focuses on four key components: data collection, data quality, communication, and best practices. As State Auditor McGuiness explained, auditing teams may investigate additional questions around COVID-19 data, but any state which uses this framework needs to fill out all parts of the rubric so that results may be easily compared across states. (To anyone who has struggled through a COVID Tracking Project data entry shift, easily comparing across states sounds like a dream.)
The questions asked by this rubric fall into three main categories: collection, reporting, and monitoring. “Collection” questions ask which metrics the state tracked, including test types, case types, outcomes, hospitalization data, and demographic information. “Reporting” questions ask how state public health departments communicated with COVID-19 testing institutions and hospitals to gather data. “Monitoring” questions ask if states took certain steps to identify errors in their data, such as ensuring that COVID-19 test results were coded directly in reports from labs. This section also includes questions about contact tracing.
The questions forming this auditing framework, as well as its overarching goal of sharing best practices and restoring public trust in data, align well with the work of many reporters and researchers documenting the COVID-19 pandemic. However, I have to wonder if this template will seem insufficient before some state auditors even begin investigating. The template refers to only two types of tests, “COVID-19 tests” (which I assume means PCR tests) and “COVID-19 antibody tests.” Antigen tests are not mentioned, nor are any of the several other testing models on track to come on the market this fall. The template also fails to discuss data on any level smaller than a county, neglecting the intense need for district- or ZIP code-level data as schools begin reopening. And it only mentions demographic data—a priority for the many states where the pandemic has widened disparities—in one line.
Plus, just because state auditors can ask additional questions specific to local data issues they’ve seen doesn’t mean that they will. Speaking to State Auditor McGuiness made it clear to me that COVID-19 data decentralization in the U.S. is not going away any time soon. Every state can’t even evaluate its data reporting in the same way, because some auditors’ offices are bound by state legislatures or are unable to access their own states’ public health records.
I look forward to seeing the results of these state data audits and making some comparisons between the 20 states committed to taking part. But to truly understand the scope of U.S. data issues that took place during this pandemic and set up best practices for the future, we need more than independent state audits. We need national oversight and standards.
Analyzing COVID-19 data in Florida is like wading through a swamp with rocks in your backpack while wearing a hazmat suit and being shouted at by a hundred people who all think they can go faster than you.
There are so many problems with Florida’s data, that when Rebecca Glassman and Olivier Lacan, another CTP volunteer, tried to draft a short blog post about what was wrong, they ended up writing about 3,000 words. Florida reports a test positivity rate without publishing the underlying numbers for their calculation, making it impossible for researchers to check the figures. Florida doesn’t report probable cases and deaths, which is recommended by the CDC. Florida is mixing its PCR and antigen test results (and likely including both in its test positivity rate. Florida fails to alert people using its COVID-19 website and dashboard when the state faces data issues. Florida literally fired a scientist at its public health department who refused to manipulate the state’s data.
But hey, at least their daily PDF reports are under 1,000 pages now.
I’m starting to think I should make HHS hospitalization data a weekly section of this newsletter.
In case you haven’t read my previous two issues, here’s the situation: in mid-July, hospitals stopped reporting their counts of COVID-19 patients to the CDC, and instead began reporting to the HHS. Since then, HHS’s national hospitalization dataset has been unreliable. HHS’s counts of currently hospitalized COVID-19 patients are far higher than the concurrent counts reported by state public health departments, and HHS’s numbers often rise and fall significantly from day to day without clear explanation.
I, along with other COVID Tracking Project (CTP) volunteers, have been monitoring both hospitalization counts daily—the two counts being, HHS’s numbers and state-reported numbers compiled by CTP. Rebecca Glassman (data entry volunteer and resident Florida expert) and I have drafted a blog post for CTP about the biggest discrepancies we’ve seen, which will be published in the next few days.
Here’s a little preview of the issues we’re calling out:
In six states, HHS’s counts of currently hospitalized COVID-19 patients are, on average, at least 150% higher than the state’s counts. These states include Maine, Arkansas, New York, Connecticut, New Hampshire, and Delaware.
Both Florida and Nevada saw unexplained spikes in their HHS counts which were not matched by corresponding spikes in state counts.
The state of Louisiana actually reports more currently hospitalized COVID-19 patients than HHS does, even though the definitions used by both sources suggest that this discrepancy should be the other way around.
Many states do not have publicly available or easy-to-find definitions for how currently hospitalized COVID-19 patients are classified.
HHS’s counts on August 6 were very low across the board, with significant drops in the number of hospitals reporting in every state.
If you are a local reporter in any of the states mentioned here and would like to investigate the discrepancies in your area, please reach out to me! I’m happy to share the data underlying this analysis.
This section was inspired by a question my friend Abby messaged me yesterday. She asked:
How come there don’t seem to be any stats on active cases? Obviously it’s important to track new cases, but what I mostly want to know is, what is the likelihood that, if I run into someone on the street, they have COVID-19, and it doesn’t seem like new cases tells me that.
In response, I explained that active cases are pretty difficult to track in a country that hasn’t even managed to set up robust contact tracing at national or state levels. To keep tabs of active cases, a public health department would essentially need to call all infected people in its jurisdiction at regular intervals. Those people would need to answer questions about how they’re doing, what symptoms they have, and if they had gotten tested recently. This type of tracking might be doable for some smaller counties, but it’s challenging in larger counties, areas with swiftly rising COVID-19 case counts, areas without sufficient testing capacity, areas with health disparities where some residents aren’t likely to answer a call from a contact tracer… you get the idea.
But it’s still possible to model how many people sick with COVID-19 are likely present in a community at a given time. Epidemiologists and statisticians can use a region’s new case rate—the number of people recently diagnosed with COVID-19—and other COVID-19 metrics, along with population density and demographic information, to estimate how many people in that region are currently infected. A recent analysis in the New York Times used this type of method to estimate how many infected students might come to schools across the country.
If you’d like to see the likely infection rate in your area, check out the COVID-19 Event Risk Assessment Planning Tool developed by researchers at the Georgia Institute of Technology and Applied Bioinformatics Laboratory. Select a state and an event size, and the tool will tell you how likely it is that someone sick with COVID-19 is at this event. For example, at a 50-person event in New York: 2.2% risk. At a 50-person event in Florida: 21.3% risk.
So far in this pandemic, there have been two main players for determining who has been infected with SARS-CoV-2, the virus which causes COVID-19.
There are polymerase chain reaction (PCR) tests, or molecular tests, which identify viral genetic material in a patient’s ear, nose, and throat cells. And there are antibody tests, or serology tests, which identify cells produced by a patient’s immune system response in their bloodstream. PCR tests are also called “diagnostic” tests, because they are used to conclusively diagnose patients with COVID-19.
If you get a positive PCR test result, you know that you currently have the disease; you should begin self-isolating and should tell anyone with whom you recently had in-person contact to do the same. Antibody tests, on the other hand, are not diagnostic: they identify patients who have built up an immune response to COVID-19, likely (but not certainly) because they were infected with it. If you get a positive antibody test result, your local public health department would likely count you as a “probable” or “suspected” case.
In May, however, a new type of testing came on the scene. The Food and Drug Administration (FDA) authorized its first antigen test on May 9, and its second antigen test on July 6. By the end of July, both types of antigen tests had been distributed to hundreds of nursing homes across the country.
What are antigen tests? Antigen tests, like PCR tests, involve putting a swab up a patient’s nose. The swab takes a sample of potentially infected cells; the sample is then placed in a special chemical solution that breaks down the cells and flags the presence of antigens, unique pieces of the SARS-CoV-2 virus which normally live on the outside of the virus’ structure and are a key piece of immune system response. The testing process can be done in about fifteen minutes, and does not require the complex equipment needed to perform a PCR test.
This ten-minute video from Medmastery gives a detailed explanation of how antigen tests work. You can also see a brief overview of how antigen tests compare to PCR and antibody tests here:
Proponents of antigen tests suggest that these tests may one day become so readily available and so easy to use that high-risk workers and those in outbreak areas could test themselves before leaving the house. FDA leaders point out in their May 9 statement about the first authorized antigen test:
Antigen tests are also important in the overall response against COVID-19 as they can generally be produced at a lower cost than PCR tests and once multiple manufacturers enter the market, can potentially scale to test millions of Americans per day due to their simpler design, helping our country better identify infection rates closer to real time.
However, while antigen tests are technically diagnostic—they can tell you if you have COVID-19 right now—they do not meet the epidemiological gold standard for accurate testing. Antigen tests have a high specificity, meaning that they do not identify many false positives; if you receive a positive COVID-19 antigen test result, you can be pretty sure your result is correct. But they have a lower sensitivity than PCR tests, meaning that these tests may miss identifying people who are, in fact, infected with SARS-CoV-2. If you receive a negative COVID-19 antigen test result, but you have symptoms that match the disease or recently came into contact with someone who was infected, an epidemiologist would advise you to check your result by getting a PCR test.
Antigen tests are useful in quickly identifying COVID-19 patients who may be isolated and begin receiving treatment. And, once these tests are more readily available, they will useful in determining infection rates in a broad population. But because of that low test sensitivity, someone with a positive antigen test result cannot be considered a “confirmed case of COVID-19” by public health departments.
Who is conducting antigen tests? As I covered in last week’s issue of this newsletter, nursing homes are doing antigen tests, big time. On July 14, the Trump Administration and the Department of Health and Human Services (HHS) announced that COVID-19 antigen tests would be distributed to nursing homes in hotspot areas. On July 31, the CDC’s Dr. Robert Redfield claimed in the congressional subcommittee hearing on national coronavirus response that nearly one million of these test kits had already been distributed.
The Associated Press reported on August 4 that, according to HHS’s Admiral Brett Giroir, this distribution program is on track to get 2,400 antigen test machines and test kits to go with them out to nursing homes by mid-August. However, the HHS’s supply only includes enough tests for most nursing homes to test all of their residents once, and all of their staff twice. Many nursing home administrators will need to make their own deals with suppliers, or get support from state public health departments, in order to continue doing antigen testing after their federal supplies run out.
Antigen tests are also gaining prominence in Texas, where high case rates have put testing in high demand. In an analysis for the Houston Chronicle, published on August 2, Matt Dempsey, Stephanie Lamm, and Jordan Rubio estimated that tens of thousands of COVID-19 cases had been identified by antigen tests across the state. This analysis was based on data from the 11 Texas counties that published independent antigen test counts as of August 2. Texas’ Department of State Health Services (DSHS) only includes cases confirmed by PCR tests in its official total case count—a decision which may be more epidemiologically valid, but has caused confusion at the local level:
On July 16, DSHS removed almost 3,500 cases from Bexar County’s case totals, saying the cases were “probable” and not confirmed because they were from antigen test results.
San Antonio officials pushed back.
“To be clear, this is not an ‘error’ in Metro Health’s reporting,” said Colleen Bridger, San Antonio’s interim director of public health, in a press release. “This is a disagreement over what should be reported in total counts.”
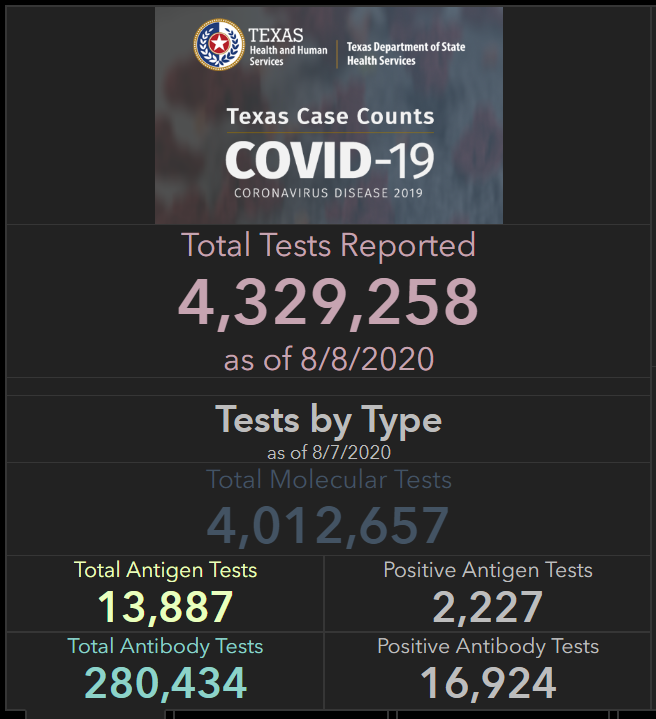
On August 8, DSHS began reporting antigen tests on its Texas Tests and Hospitals dashboard. The August 8 numbers include about 14,000 total antigen tests, with about 2,000 positive results. Based on the Houston Chronicle’s analysis, this is likely a significant undercount—but at least Texas is starting to publish some numbers.
How are antigen test results being reported nationally? Outside of Texas, antigen test numbers are hard to come by. As of the time I send this newsletter, only two other states report official antigen test counts: Kentucky and Utah. Kentucky reports 459 antigen tests as of August 8 (they do not report how many of these tests were positive). Utah reports about 5,000 people tested with antigen tests as of August 4, with about 500 of those people receiving a positive result.
At the COVID Tracking Project, we have an important procedure: when folks on the data entry team notice that something new is happening with COVID-19 data—say, a new type of test gets approved by the FDA, or hospitals undergo a major change in their reporting protocol—we ask our outreach team, a group of reporters affiliated with the project, to write to every state public health department and ask them how they’re dealing with the change. Most states public health departments have now received questions about antigen testing (and pool testing, but that’s the subject for another newsletter). Answers generally fall in the range of, “We’re not doing antigen testing,” “We’re not doing it at the state level but some commercial labs are,” and “We’re starting to monitor it and include positive antigen tests as probable cases.”
Pennsylvania is one example of the third approach:
It’s not bad that states are including positive antigen tests as probable cases—as I said earlier, antigen tests are not accurate enough to confirm a case of COVID-19. But when states combine results from different test types in a single count, it is difficult to accurately calculate test positivity rates, testing rates per population, and other important metrics. COVID Tracking Project founders Alexis Madrigal and Rob Meyer explained this issue in detail back in May, when some states (and the CDC) were combining PCR and antibody test results. The same basic principle still applies: each test is used for a different purpose and has a different level of accuracy, and so its results should be reported separately.
And what about those thousands of antigen tests that were distributed to nursing homes? As I reported in last week’s issue, the national Nursing Home COVID-19 Public File does not specify what types of tests nursing homes are using to identify cases, nor do state-reported datasets on COVID-19 in nursing homes. A FAQ document put out by the Center for Medicare and Medicaid Services (CMS) states that nursing homes are required to “report the results of the COVID-19 tests that they conduct to the appropriate federal, state, or local public health agencies.” This includes, presumably, state public health departments and the HHS. But it is unclear whether either HHS’s or CMS’s datasets will be adjusted to include antigen test counts. I reached out to CMS’s press office asking about these results, and have yet to receive a response.
This is likely only the beginning for antigen tests. Politico reported earlier today that Admiral Giroir “hopes to have 20 million rapid point-of-care tests available per month by September.” Scientists quoted in a recent New York Times article cite antigen tests as a key technology for improving America’s testing speed. Both manufacturers producing FDA-approved antigen tests, Quidel and BD, cite supply issues which will make it difficult for them to meet demand from nursing homes and local public health departments. Still, the federal government has made antigen tests a priority, and I predict that their prevalence will only grow. COVID-19 data producers must adjust their reporting accordingly.
Public health departments, underfunded and under threat: This week, Kaiser Health News (KHN) data reporter Hannah Recht released the dataset behind KHN and The Associated Press’s recent feature on how local public health departments in the U.S. have been left unprepared to face COVID-19. The dataset includes six files examining spending and staffing at public health departments across the country.
COVID-19 testing sites: The healthcare company Castlight has built a comprehensive database of COVID-19 testing sites in the U.S., down to the ZIP Code level. Castlight’s Tableau dashboard allows users to explore this database by county and compare the number of available test sites with current case counts. This dataset was cited in a recent 538 article on testing disparities.
The CoronaVirusFacts Alliance Database: Since the start of the pandemic, Poynter’s International Fact-Checking Network has connected fact-checkers in over 70 countries working to correct COVID-19 misinformation. The results of these fact-checkers’ work are compiled in a database, which you can search by country, fact rating, and topic.
This past Tuesday, several top state auditors announced a joint initiative: they’re going to review how state COVID-19 data are collected and reported. Auditors from five states—Delaware, Florida, Mississippi, Ohio, and Pennsylvania—worked with the National State Auditors Association to put together a framework that every state can use. 13 other states, as well as D.C. and Puerto Rico, have already expressed interest in using the framework.
This data audit was the brainchild of Delaware State Auditor Kathleen McGuiness, who describes her motivations in a Delaware press release:
I saw variation in the reporting and monitoring of COVID-19 cases by states nationally and felt it was important to have a consistent tool for states to easily review and share information about how their state’s approach to data use informs COVID-19 mitigation efforts. It’s an issue every state is grappling with during this pandemic, and I’m proud to lead this effort toward a universal goal.
The results of this audit won’t be shared for several months, but it’s good news that the initiative is at least taking place. Where the federal government has failed to institute data standards, the states are taking matters into their own hands. This is the most interested I’ve been in auditing since I watched Parks and Recreation season three.