- Healthcare worker burnout trend backed up by new data: The COVID-19 pandemic has exacerbated a growing burnout crisis among healthcare workers in the U.S., as many articles and scientific papers have explored in the last couple of years. Two studies from the past week add more data to back up the trend. CDC researchers shared the results of a survey of about 2,000 workers, finding that workers were more likely to report poor mental health and burnout in 2022 than in 2018, while harassment and a lack of support at work contributed to increased burnout. Another research group (at the University of North Carolina at Greensboro and Washington University in St. Louis) also surveyed healthcare workers and found that many experienced food insecurity and financial challenges; workers with worse employer benefits were more likely to increase these challenges.
- Viral load not necessarily associated with symptoms: This paper is a rare, relatively recent update on how COVID-19 symptoms connect to viral load, or the amount of virus that a patient has in their respiratory tract. The higher a patient’s viral load, the more likely they are to infect others, making this an important metric for contagiousness. Researchers at Emory University studied viral loads in about 350 people diagnosed with Omicron variants between April 2022 and April 2023. Patients tended to have their highest viral loads around the fourth day of symptoms, a change from studies done on earlier variants (when viral loads tended to peak along with symptoms starting). As Mara Aspinall and Liz Ruark explain in their testing newsletter, these results have implications for rapid at-home tests, which are most accurate when viral loads are high: if you’re symptomatic but negative on a rapid test, keep testing for several days, and consider isolating anyway.
- Updated vaccines are key for protection: Another recent paper, in The Lancet Respiratory Medicine, examines how last year’s bivalent COVID-19 vaccines worked against recent coronavirus variants using data from the Kaiser Permanente health system. The study included records from about 123,000 people who had received at least the original vaccine series, examining health system visits from August 2022 to April 2023. People who received an updated vaccine in fall 2022 were significantly less likely to have severe COVID-19, the researchers found. “By mid-April, 2023, individuals previously vaccinated only with wild-type vaccines had little protection against COVID-19,” the researchers wrote. This year’s updated vaccine may have a similar impact through spring 2024.
- Gut fungi as a potential driver for Long COVID: Long COVID, like ME/CFS and other chronic conditions, may be associated with problems in patients’ gut microbiomes, i.e. the communities of microorganisms that live in our digestive systems. A new paper in Nature Immunology from researchers at Weill Cornell Medicine hones in on one fungal species that may be particularly good at causing problems. The species, Candida albicans, can grow in the intestines of severe COVID-19 and Long COVID patients, triggering to inflammation and other immune system issues. This paper describes results from patient samples as well as a mouse model mimicking how this fungal species grows in COVID-19 patients’ guts.
- Another potential Long COVID biomarker: One more notable Long COVID paper from this week: researchers at the University of Alberta studied blood samples from people with the condition, and compared their results to people who had acute COVID-19 but didn’t go on to develop long-term symptoms. The scientists used machine learning to develop a computer model differentiating between blood composition of people who did and didn’t develop Long COVID. They identified taurine as one specific amino acid that might be particularly important, as levels of taurine were lower among patients with more Long COVID symptoms. The study could be used to inform diagnostic tests of Long COVID, as well as potential treatments to restore taurine.
Author: Betsy Ladyzhets
-
Sources and updates, October 29
-

HV.1, JN.1: Variants to watch this fall and how we’re tracking them
HV.1, a relative of the XBB.1.5 variant family, is the most prevalent variant in the U.S. right now, according to CDC estimates. As winter approaches, pretty much every public health expert I follow is anticipating a COVID-19 surge. Experts anticipate that indoor gatherings and travel for the holiday season—with fewer COVID-19 precautions than we had earlier in the pandemic—will lead to more disease spread, just as these behaviors have historically contributed to more spread of flu and other common pathogens this time of year.
While it seems a surge is likely, the size and severity of that surge may depend in part on SARS-CoV-2 variants. Variants can evolve to more efficiently reinfect people who got COVID-19 recently or to evade our vaccines. These explosive variants can add fuel to the fire when people are already spending a lot of time indoors together with relatively few precautions, as we saw with the original Omicron in winter 2021-22.
As a result, experts are closely watching a few current variants that might lead to faster COVID-19 spread this winter. Here’s a review of what’s circulating right now, what to watch for in the coming weeks, and how our public health system is tracking the variants.
XBB.1.5 and relatives
Omicron XBB emerged in late 2022 when two different versions of BA.2, one of the first Omicron lineages, merged together in an evolutionary process called recombination. While the original XBB didn’t really take off globally, it started to mutate as it spread in the U.S., leading to XBB.1.5 in early 2023. See my FAQ post from January for more details.
XBB.1.5 has remained a dominant lineage in the U.S. and globally for much of this year. Scientists tracking variants have mostly identified new variants that descend from XBB.1.5, though you might not guess it from the naming schemes which often shorten names for convenience (for example, XBB.1.9.2.5 became EG.5). As a result, the FDA advised vaccine manufacturers to base their COVID-19 shots for this year on XBB.1.5.
EG.5 and FL.5.1
EG.5 and FL.5.1 are two of those XBB.1.5 relatives, descended from the XBB recombinant variant with enough evolutionary steps that virologists gave them these shorthand titles. These two variants are notable because they share a specific mutation, dubbed “FLip,” which helped the variants reinfect people more easily after prior infection or vaccination.
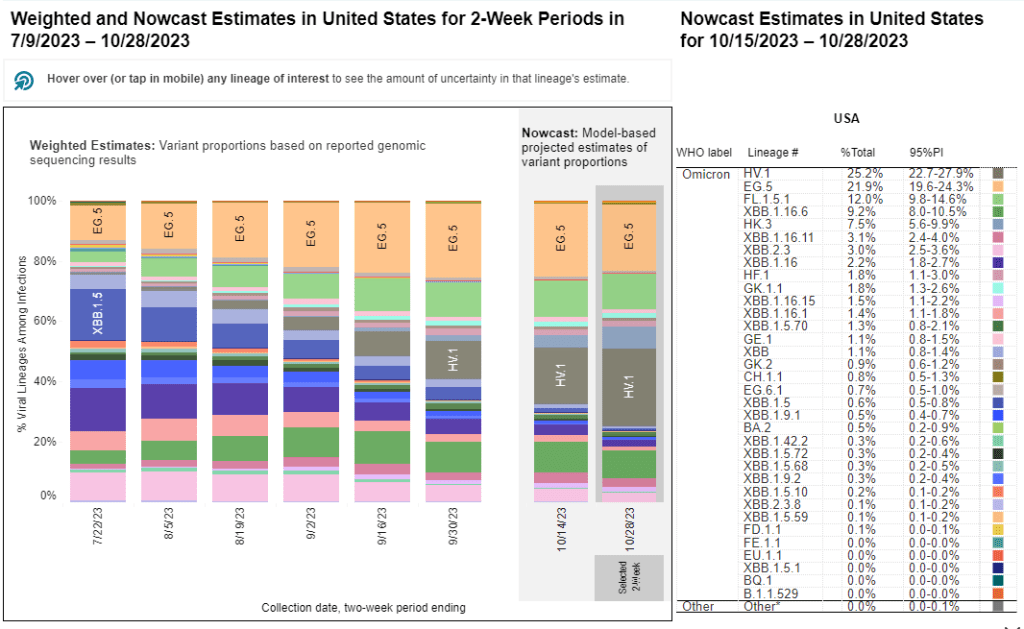
The CDC’s variant surveillance estimates suggest that EG.5 and FL.5.1 have been prominent—but not really dominant—variants in the U.S. this fall. In the CDC’s most recent update, the agency estimates that these variants caused 22% and 12% of cases respectively during the two weeks ending October 28. They don’t appear different enough from other XBB.1.5 relatives to really break through and cause a surge.
HV.1, descendant of EG.5
HV.1 evolved from EG.5, making it another XBB.1.5 relative. It’s the most common variant in the U.S. right now, with the CDC’s latest update estimating that it caused about one in four COVID-19 cases during the last two weeks. Like the other variants discussed above, HV.1 has a slight evolutionary advantage over its relatives; but it’s not significantly different enough to cause a huge surge right now.
BA.2.86
BA.2.86 got some attention when it emerged in August. This variant, unlike the others that have circulated in 2023, is not related to XBB.1.5. Instead, it takes us back in the coronavirus’ evolution, as it evolved directly from BA.2—a version of Omicron that spread widely back in early 2022. Scientists expressed concern about some worrying mutations in BA.2.86 and wondered if our vaccines, matched to XBB.1.5, might not work well against it.
Two months later, BA.2.86 hasn’t spread widely around the world as scientists worried that it might. It doesn’t appear to have a huge advantage over the XBB.1.5 descendants. While CDC surveillance has identified BA.2.86 across the U.S., it’s caused less than 1% of cases, according to the agency’s estimates.
JN.1, descendant of BA.2.86
But BA.2.86 could still indirectly cause some problems: this variant, like all the others, has been mutating. In the last couple of weeks, scientists have started to closely watch one BA.2.86 descendant called JN.1. JN.1 has picked up mutations that make it better at evading immunity from past infections or vaccinations, leading, of course, to faster spread.
Eric Topol describes the global rise of JN.1 in a recent Substack post:
JN.1 has shown up in many countries now, besides France and the UK, including the US, Iceland, Portugal, Belgium, Israel, Spain, Netherlands, Canada Germany, and Singapore. Other derivatives of BA.2.86 such as JN.2 and JN.3 are also being identified in multiple countries.
We won’t know for a few weeks as to whether JN.1 will be linked with a significant rise in COVID or how well our immune response from prior vaccinations, infection(s) and the XBB.1.5 new booster will keep us protected.
So, while BA.2.86 itself may be more benign than expected, JN.1 and its relatives are worth watching. Sequence data shared in the global repository GISAID suggest that this variant is spreading quickly globally, and may be contributing to increased spread in France in particular.
How we’re tracking variants
As I described in my post about BA.2.86, the U.S. has a few ways of tracking variants. The CDC recently highlighted four key surveillance systems in a report about monitoring BA.2.86, published in the agency’s Morbidity and Mortality Weekly Report:
- The national SARS-CoV-2 genomic surveillance program, in which the CDC and commercial partners anonymously select and sequence samples from people who had positive COVID-19 PCR tests;
- The Traveler-based Genomic Surveillance program, in which international travelers returning to U.S. airports can voluntarily get PCR-tested in groups;
- The National Wastewater Surveillance System, in which some public health labs sequence sewage samples that are part of the CDC’s wastewater surveillance program (with about 400 sewersheds participating in sequencing);
- Digital public health surveillance, using coronavirus sequences that are shared on public, open-source platforms like GISAID.
CDC scientists use all four of these systems to keep track of variants circulating in the U.S. Sequencing wastewater samples is particularly important these days with fewer PCR tests available, I argued in a post last month.
Variants don’t happen in isolation
Sometimes, news reports about coronavirus variants cover the virus’ evolution as though it happens in isolation. Like the virus is just mutating in a vacuum, and would do so forever regardless of our human behavior.
But this isn’t accurate. The coronavirus mutates because we keep spreading it, with each infection creating an opportunity for new mutations to arise. If our public institutions really took measures to stop COVID-19 from spreading, it would also be much harder for the virus to keep evolving and evading us.
As variant expert J.P. Weiland pointed out on Twitter: “Timing is so important for impact. If it [JN.1] becomes dominant before the holidays, the wave will be quite a lot bigger than dominance in Jan.”
So, in case you need another motivator to keep up the COVID-19 precautions this holiday season: consider it doing your part to reduce viral evolution.
More variant data
-
National numbers, October 29

Biobot Analytics resumed weekly updates to its COVID-19 wastewater dashboard this week. During the most recent week of data available (October 15-21), the U.S. reported about 16,200 new COVID-19 patients admitted to hospitals, according to the CDC. This amounts to:
- An average of 2,300 new admissions each day
- 4.9 total admissions for every 100,000 Americans
- 0% fewer new admissions than the prior week (October 8-14)
Additionally, the U.S. reported:
- 8.7% of tests in the CDC’s surveillance network came back positive
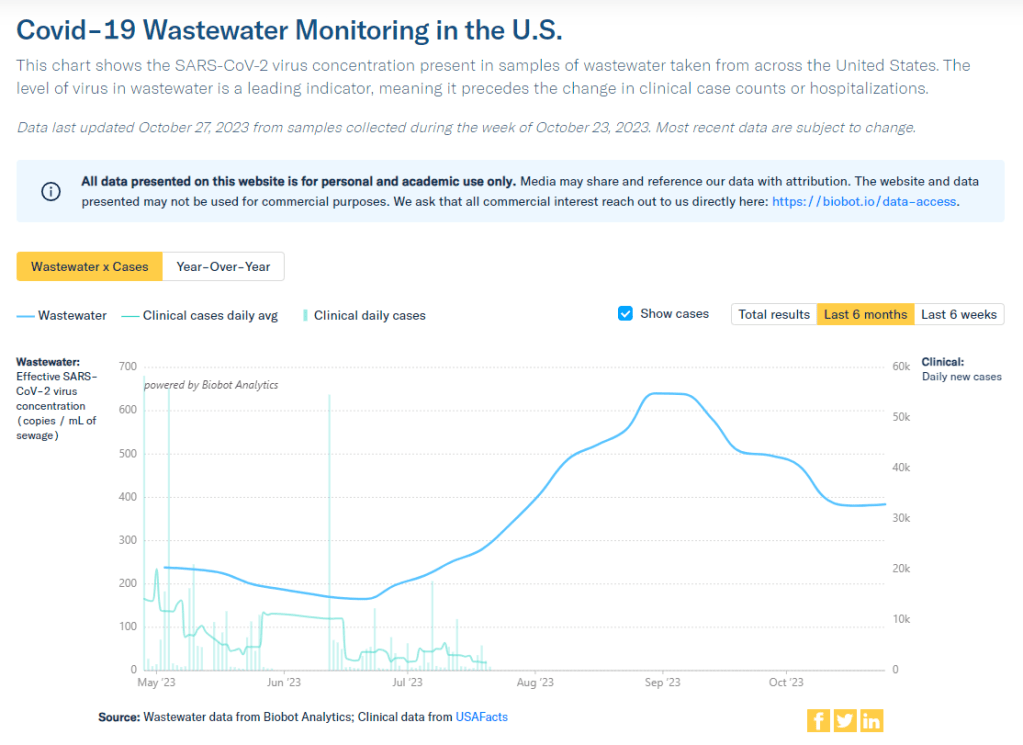
- A 1% higher concentration of SARS-CoV-2 in wastewater than the prior week (as of October 25, per Biobot’s dashboard)
- 25% of new cases are caused by Omicron HV.1, 22% by EG.5, 17% by XBB.1.6, 12% by FL.1.5.1 (as of October 28)
Our mid-fall COVID-19 lull continues in the U.S., with major metrics showing plateaus in disease spread nationally. A disruption in wastewater surveillance may make it harder to follow these trends in the coming weeks.
Biobot Analytics has resumed weekly updates to its COVID-19 dashboard as of this Friday. While the company is no longer testing about 400 sites in the CDC’s surveillance network due to a contract switch, its independent network still represents more than 100 counties across the U.S., according to Biobot’s Twitter.
Meanwhile, Biobot has filed a formal protest about the CDC contract change. According to reporting by POLITICO, the new contractor, Verily, cannot start testing at those 400 wastewater treatment sites while the Government Accountability Office (GAO) evaluates Biobot’s appeal. The protest will extend the data gap that I described in my previous posts about this contract, possibly delaying surveillance for months as we head into the winter respiratory virus season.
With these gaps in mind, here’s what the limited wastewater surveillance data tell us. Biobot’s national dashboard shows declines in coronavirus spread from mid-September through mid-October, followed by a very slight (1%) increase in the week ending October 25. Regionally, spread is down in the Northeast and West Coast and up slightly in the South and Midwest.
WastewaterSCAN’s latest update shows similar trends: a decline nationally in the last month, and recent upticks in the Midwest, South, and possibly West as well. There’s not a clear pattern as to which states are seeing more increases right now; it’s more of a slight uptick across the board, as the WWSCAN team describes the trend.
Test positivity and hospitalization data from the CDC also suggest lulls. New hospitalizations for COVID-19 have not changed significantly in the last couple of weeks, staying at about 2,300 per day. The variant picture is still dominated by versions of XBB; more on this below.
As we get further into respiratory virus season, COVID-19 is likely to join forces with other common pathogens to put pressure on the healthcare system, just like we saw last year. But the tools needed to control those viruses’ spread are less available than ever, with masks, tests, vaccines, and surveillance data all harder to find.
So far, just 12 million people have received this year’s COVID-19 vaccines, per CDC estimates. POLITICO reports that CDC Director Dr. Mandy Cohen considers this number “on track” for the year, suggesting the agency is unlikely to put more resources into making the shots accessible.
-
COVID source shout-out: Biobot’s dashboard is still sharing COVID-19 data
Two weeks ago I wrote an article explaining that the CDC has a new wastewater contract, essentially transferring responsibility for COVID-19 testing at hundreds of wastewater treatment plants across the country from Biobot Analytics to a company called Verily, which is affiliated with Google. In the time since that post, I have seen some other articles and social media posts alleging that, thanks to the contract change, Biobot will no longer be posting any COVID-19 data on their dashboard. This is inaccurate!
It is true that Biobot no longer has access to data from about 400 sites that were part of the CDC contract. But Biobot still has its own testing network separate from the CDC’s—which actually predated its contract with the agency—and which includes hundreds of other sites across the country that either have individual contracts with Biobot or are receiving free testing in exchange for sharing data.
Copying from my post two weeks ago: on Biobot’s dashboard, “County-level data won’t change. National and regional data will still be available, but are likely to be less comprehensive pictures of wastewater trends across the U.S., if I’m right about Biobot no longer including CDC contract sites in those visualizations.” In fact, Biobot updated its dashboard this past Friday and will resume weekly updates soon, after making some changes to its data processing systems, according to social media posts from the company.
Meanwhile, it is currently unclear how the new contract will impact data on the CDC’s wastewater dashboard as well as on Verily’s own dashboard. On the CDC dashboard, you can see that contract sites are not reporting wastewater data while they switch testing providers. Verily has a dashboard that currently shows data from WastewaterSCAN, a separate program that already uses Verily to test its samples; this dashboard hasn’t added CDC sites yet as far as I know.
I’m not sharing the inaccurate posts I mentioned to avoid giving them extra attention, but I wanted to provide this extra update in case any readers had seen those posts and were confused. Once again: Biobot is still sharing data, it’s just less comprehensive, and I would still recommend going to their dashboard for COVID-19 trends. In this era of fragmented surveillance, it’s always good to rely on multiple dashboards (eg. CDC, Biobot, WastewaterSCAN) rather than just one.
-
Sources and updates, October 22
- Serotonin as a potential Long COVID biomarker: The chemical messenger serotonin might play a role in causing Long COVID symptoms, according to a new paper published this week in Cell. Researchers at the University of Pennsylvania and colleagues studied blood samples of people with Long COVID and animal models of the condition. They found that people with Long COVID have reduced levels of serotonin throughout their bodies, and that these reductions are correlated with common Long COVID symptoms such as brain fog and autonomic dysfunction. The study also examines biological mechanisms that could play a role in causing reduced serotonin; it provides new information about how a coronavirus infection could trigger long-term symptoms, as well as potential biomarkers for clinical trials. For more context, see this coverage in STAT News.
- Healthcare costs of Long COVID: Another Long COVID study from this week, posted as a preprint in The Lancet: researchers at University College London tracked about 282,000 people with Long COVID over the course of two years, compiling their healthcare costs from National Health System (NHS) data. The study included people diagnosed with Long COVID between January 2020 and January 2023, compared with people who did not have Long COVID but had similar demographic characteristics. Long COVID led to higher healthcare spending, the study found, costing about 3,400 British pounds per patient per year. The researchers also noted that, for people with Long COVID, cost increased progressively over time. These costs are far greater for people in the U.S. where most healthcare is privatized.
- Hospital-acquired COVID-19 cases: And another British study: researchers at the U.K. Health Security Agency and London School of Hygiene & Tropical Medicine analyzed data from about 350 British hospitals to estimate the prevalence of hospital-acquired coronavirus infections, or people who got the virus while in the hospital for something else. The team found that hospital-acquired infections represented 95,000 to 167,000 cases between June 2020 and March 2021 (i.e. 1% to 2% of all hospital admissions during this period). The researchers also found that people who got COVID-19 at the hospital were more likely to transmit it to other patients, and that more crowded hospitals with fewer single rooms were more likely to have in-hospital transmission. This study demonstrates a need for better infection control measures in hospitals, such as masking, improved ventilation, etc.
- Wastewater surveillance for climate-resilient pathogens: In a new article in Science, researchers at the Rockefeller Foundation and the Santa Fe Institute argue that wastewater surveillance should be expanded on a global scale with a interest in tracking pathogens that are resilient to climate change. Pathogens like cholera, Lyme disease, dengue virus, and Zika virus, which can spread more widely in a warming planet, are posing increased risks to global health, the authors explain. Wastewater surveillance—as a population-level, potentially-quick-responding monitoring tool—can help track these pathogens more quickly than traditional tracking methods that rely on medical facilities sharing individual health data. The authors also explain barriers to global wastewater surveillance such as the cost of these programs and their prevalence so far in higher-income countries, as opposed to in some countries where surveillance may be most needed. Significant investment is necessary to build a truly effective system, they argue.
-
Learn data journalism basics with me at an upcoming workshop
For the journalists and communicators reading this: have you ever been interested in using a dataset to tell a story, but weren’t sure which tools to use or how to get started with the project? Or are you curious about how data journalists find datasets for their reporting, and turn those numbers into accessible, visual stories? Or are you an editor who sometimes works with data journalists and would like to better understand their tools and methods to improve your collaboration?
If any of this sounds familiar, you might be interested in a workshop that I will be running with The Open Notebook on October 31 that will cover reporting and producing data stories about science topics. For those unfamiliar with The Open Notebook, it’s a nonprofit site that provides excellent training and educational materials for science journalists, including articles, mentoring programs, a book, and workshops like this one. The workshop will build on an article I wrote for TON a couple of years ago.
The full description of the workshop is below. It will take place on October 31 from 3:30 to 5 PM Eastern time. Tickets are $125, though discounted tickets are also available for those who need them. Feel free to email me if you have any questions about the event!
Science writers are used to encountering data, whether we’re reading through dense scientific papers or trying to figure out what a statistic means for our readers. But sometimes, datasets themselves can be sources for stories—and they have led to some of the most widely read science stories of the last few years, from El Pais’ visualization of coronavirus spread to ProPublica’s investigation of burning sugar cane. Datasets can help us make complex topics accessible, visualize patterns from research, or even investigate instances of wrongdoing.
A science writer interested in pursuing stories like these could find a wide variety of resources to help them get started on a data project. But the growing data journalism field can be overwhelming: you might not be sure how to pick an initial project, which online course to try, which tools to use, or whether you need to learn how to code first. (Spoiler alert: you don’t!)
This 90-minute hands-on workshop from The Open Notebook, building on the instructor’s TON article about this topic, will provide a crash course in data reporting basics. It’s designed for science writers who are interested in pursuing data stories but aren’t quite sure how to get started, and for editors who are interested in working with writers on these stories.
You’ll get an introduction to all of the steps of reporting and producing a data story, from finding story ideas to editing and fact-checking. The workshop will include an interactive tutorial showcasing two common tools that you can start using immediately.
You will learn how to:
Recognize potential data stories on your beat
Search for public datasets that you can use
Use free tools for data analysis and visualization
Work with a data team or independently as a freelancer
Make your data stories accessible -
Paxlovid will be far more expensive and covered by private insurance in 2024, likely leading to access issues
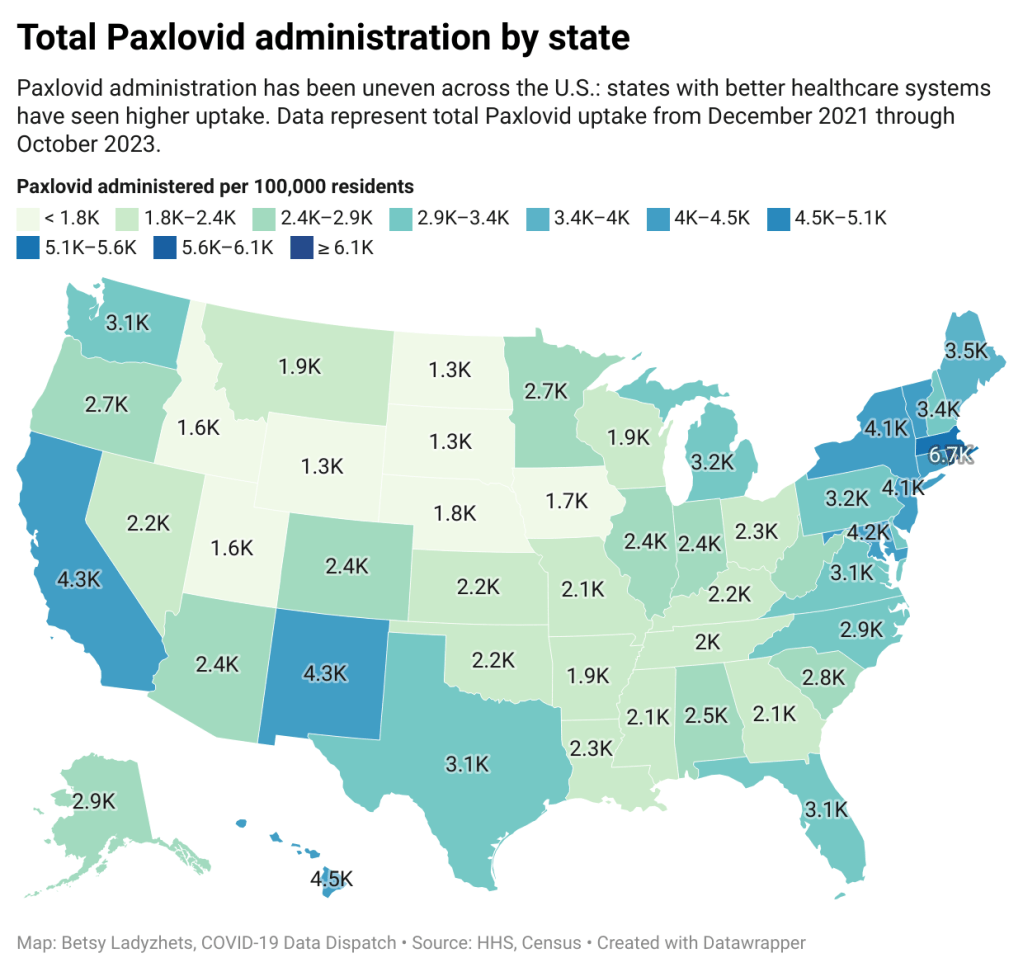
!function(){“use strict”;window.addEventListener(“message”,(function(a){if(void 0!==a.data[“datawrapper-height”]){var e=document.querySelectorAll(“iframe”);for(var t in a.data[“datawrapper-height”])for(var r=0;r<e.length;r++)if(e[r].contentWindow===a.source){var i=a.data["datawrapper-height"][t]+"px";e[r].style.height=i}}}))}();Starting in 2024, the antiviral drug Paxlovid will be a private—and expensive—treatment for COVID-19. The Department of Health and Human Services (HHS) announced about a week ago that it’s reached a deal with Pfizer, the pharmaceutical company that produces Paxlovid, to “transition” this drug into the commercial market within the next few months. The transition will lead to Paxlovid becoming even less accessible than it is now and will exacerbate health inequities that we’ve seen with this drug.
A few days ago, news outlets reported that Pfizer will charge about $1,400 per course as the list price for Paxlovid upon this transition. This is about double the price that HHS previously paid for the drug, which was about $530 per course.
HHS previously purchased about 24 million courses of Paxlovid, of which about 17 million have been distributed and 11 million have been administered, according to the agency’s data. Under the privatization agreement, HHS will return about 8 million courses back to Pfizer, which will serve as a credit for covering continued free supply to people who have Medicare, Medicaid, or who are uninsured.
According to HHS, people who have public insurance or no health insurance should continue to receive free Paxlovid through the end of 2024. And after that, Pfizer will run a patient assistance program for people who are uninsured or underinsured. Still, the transition is likely to cause health equity issues, as people who have public insurance or no insurance will have to jump through more hoops to receive free Paxlovid under these programs, as opposed to the current situation where everyone can get it for free. We’ve all seen how chaotically this fall’s vaccine rollout went, after all.
The HHS’s data for Paxlovid administration (shown above) demonstrate that states where healthcare is more easily accessible and/or where patient populations are wealthier tend to have higher rates of receiving Paxlovid over the nearly two years that it’s been available. We also know from scientific studies looking at Paxlovid that this drug has followed access issues similar to the COVID-19 vaccines and tests.
Considering these prior patterns, combined with the increasing price, it unfortunately seems like a foregone conclusion that Paxlovid will get harder to access in 2024. This will be a huge issue for preventing severe disease and death from COVID-19 as well as limiting risks of Long COVID, which research suggests Paxlovid can do as well.
If you are a reader who’s had a hard time getting Paxlovid, or if you want to share more comments or questions on this issue, please reach out.
-
National numbers, October 22

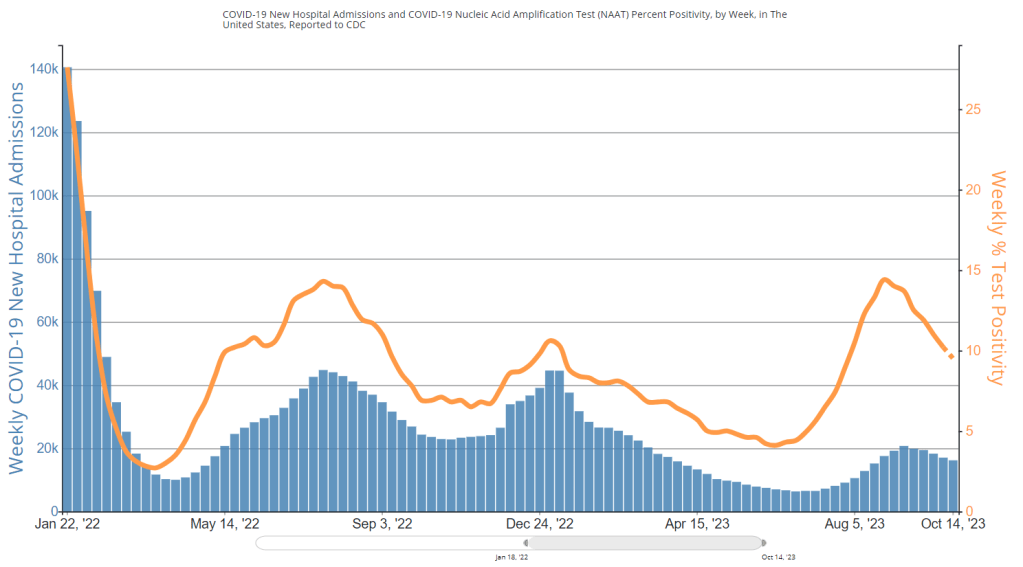
Test positivity has dipped below 10% for the first time since July, per CDC data. During the most recent week of data available (October 8-14), the U.S. reported about 16,200 new COVID-19 patients admitted to hospitals, according to the CDC. This amounts to:
- An average of 2,300 new admissions each day
- 4.9 total admissions for every 100,000 Americans
- 5% fewer new admissions than the prior week (October 1-7)
Additionally, the U.S. reported:
- 9.5% of tests in the CDC’s surveillance network came back positive
- A 14% lower concentration of SARS-CoV-2 in wastewater than the prior week (as of October 11, per Biobot’s dashboard)
- 24% of new cases are caused by Omicron EG.5, 20% by XBB.1.6, 20% by HV.1, 14% by FL.1.5.1 (as of October 14)
Major metrics suggest the U.S. is still in a lull of COVID-19 spread, as we’ve seen decreases in wastewater levels and test positivity for several weeks. Transmission is still high, though, and it seems likely that cold weather will drive up COVID-19 as well as other respiratory viruses in the coming weeks.
Biobot updated its COVID-19 wastewater dashboard this week, showing a continued decline in national coronavirus levels (with a decrease of about 35% from early September through October 11). Regionally, the company reports an increase in transmission in the Midwest and decreases in other regions, though the Northeast still has the highest coronavirus levels.
WastewaterSCAN’s dashboard similarly shows a national decline in recent weeks, and higher coronavirus levels in the Northeast and Midwest compared to the West and South. Some Northeast and Midwest sewersheds in SCAN’s network, including those in Maine, New Hampshire, Iowa, and Michigan, have reported significant recent increases.
As we discuss wastewater data, it’s worth a reminder that the CDC’s new contract with Verily has disrupted the existing surveillance landscape. Verily is working on onboarding CDC contract sites, leading to data gaps on the CDC dashboard, while Biobot’s network of sites for its national visualizations has become less comprehensive.
COVID-19 test positivity, reported by the CDC’s respiratory virus testing network, is under 10% nationally for the first time since July. Northeast and Midwest regions report higher test positivity than the West and South. Hospital admissions for COVID-19 have plateaued as well.
Influenza-like activity is mostly low across the U.S., according to the CDC’s FluView network. Only Alaska and the Northern Mariana Islands report high levels as of the week ending October 14.
COVID-19 spread so far this fall is in line with the transmission levels we saw in fall 2021, during that year’s Delta surge, and a bit below last year’s levels, per Biobot. If we continue following these trends, we will be due for increased spread in November through the end of 2023.
-
COVID source shout-out: Diagnosing and managing ME/CFS
As research on Long COVID progresses, many scientists and clinicians working on this disease are learning from other chronic conditions that share symptoms with—and are often co-diagnosed with—Long COVID. One of the most common is myalgic encephalomyelitis/chronic fatigue syndrome (ME/CFS), a condition characterized by extreme fatigue that often gets worse after physical or mental exertion.
Despite impacting millions of people prior to the pandemic, ME/CFS is not well studied; research into the condition is underfunded, and doctors typically don’t learn about it during their training. A new paper from the Rochester Mayo Clinic and ME Action, a ME/CFS advocacy group, may help change this, by offering guidelines for doctors who have patients with this condition.
The paper describes common ME/CFS symptoms, provides guidance on diagnosing the condition, explains how ME/CFS may intersect with other chronic conditions, and shares symptom management techniques, such as pacing to avoid post-exertional malaise and monitoring symptoms over time. Mayo Clinic clinicians can read the paper for continuing medical education credit.
In the week since it was published, the paper has seen wildly high engagement metrics as people with ME/CFS and Long COVID have shared it, study author Jaime Seltzer (from ME Action) wrote on Twitter. Seltzer encouraged people in these communities to share the paper with their clinicians, as a resource for doctors who weren’t previously familiar with ME/CFS.
