In this final newsletter, I wanted to highlight one of my favorite sources for new research on COVID-19 and Long COVID (and one that published a new paper recently): the Patient-Led Research Collaborative (PLRC). PLRC is an independent research group including people with Long COVID and related chronic diseases, such as ME/CFS and POTS, who also have scientific research experience.
This organization has been a leader in Long COVID research since May 2020, when it published a study describing persistent symptoms among people who got COVID-19 earlier that spring. The group’s further papers have included comprehensive analyses of Long COVID symptoms and reviews of other research. In addition to running studies, the organization funds biomedical research, publishes patient-generated hypotheses for scientists, and advocates for better patient engagement in Long COVID research.
PLRC has regularly pushed the Long COVID field forward, with papers addressing under-studied topics like reproductive health and mental health. Their latest paper similarly provides data about working with Long COVID, an issue that is under-studied yet frequently discussed in the Long COVID community. The paper summarizes results from a survey of about 500 people with Long COVID describing the condition’s impact on their work.
From the survey results, the researchers found four primary themes: 1) people with Long COVID want to return to work, motivated by financial pressures and a sense of purpose for their jobs; 2) diverse, complex, and sometimes inconsistent Long COVID symptoms can interfere with work and other day-to-day tasks; 3) people face disbelief and stigma due to Long COVID; and 4) support from medical providers is important for returning to work. These findings align with stories I’ve heard from people with Long COVID whom I’ve interviewed for stories, as well as conversations I’ve read online.
We're happy to release a new patient-led paper on returning to work & episodic disability in #LongCovid!
— Patient-Led Research Collaborative (@patientled) November 9, 2023
If you’re looking to keep up with impactful Long COVID research, PLRC—along with the organization’s collaborators and projects it has funded—is an important group to follow.
New vaccination data from the CDC: The CDC has started publishing vaccination data reflecting how many Americans have received COVID-19, flu, and RSV shots in fall 2023. These numbers are estimates, based on the CDC’s National Immunization Survey, as the agency is no longer directly compiling COVID-19 vaccinations from state and local health agencies. (See this post from last month for more details.) According to the estimates, about 28% of American adults have received a 2023 flu shot, compared to 10% who have received a 2023 COVID-19 shot. The numbers reflect poor communication about and accessibility challenges with this year’s COVID-19 vaccines.
FDA approves a rapid COVID-19 test: Following the end of the federal public health emergency this spring, the FDA has advised companies that produce COVID-19 tests to submit their products for full approval, transitioning out of the emergency use authorizations that these tests received earlier in the pandemic. The FDA has now fully approved an at-home COVID-19 test: Flowflex’s rapid, antigen test. This is the second at-home test to receive approval, following a molecular test a few months ago. The Floxflex test “correctly identified 89.8% of positive and 99.3% of negative samples” from people with COVID-like respiratory symptoms, according to a study that the FDA reviewed for this approval.
WHO updates COVID-19 treatment guidance: This week, the World Health Organization updated its guidance on drugs and other treatment options for severe COVID-19 symptoms. A group of WHO experts has regularly reviewed the latest evidence and updated this guidance since fall 2020. The update includes guidelines on classifying COVID-19 patients based on their risk of potential hospitalization, recommendations for drugs such as nirmatrelvir and corticosteroids, and recommendations against other drugs such as invermectin and hydroxychloroquine. Clinicians can explore the guidance through an interactive tool that summarizes the expert group’s findings.
Gargling with salt water to reduce symptoms: Speaking of COVID-19 treatments: gargling with salt water may help people with milder COVID-19 symptoms recover more quickly, according to a new study presented at the American College of Allergy, Asthma and Immunology’s annual conference. The researchers compared COVID-19 outcomes among people who did and did not use salt water for 14 days while sick; those who used the treatment had lower risks of hospitalization and reported shorter periods of symptoms. This study has not yet been peer-reviewed and more research will be needed, but it’s still helpful evidence to back up salt water as a potential treatment (something I’ve personally seen recommended anecdotally in the last couple of years).
Allergies as potential Long COVID risk factors: Another study that caught my attention this week: researchers at the University of Magdeburg in Germany conducted a review of connections between allergies and Long COVID. The researchers compiled data from 13 past papers, including a total of about 10,000 study participants. Based on these studies, people who have asthma or rhinitis (i.e. runny nose, congestion, and similar symptoms, usually caused by seasonal allergies) are at higher risk for developing Long COVID after a COVID-19 case. The researchers note that this evidence is “very uncertain” and more investigation is needed; however, the study aligns with reports of people with Long COVID getting diagnosed with mast cell activation syndrome (or MCAS, an allergy-related condition).
Dropping childhood vaccination rates: One more notable study, from the CDC’s Morbidity and Mortality Weekly Report (MMWR): vaccination rates for common childhood vaccines are declining among American kindergarteners, according to CDC research. CDC scientists reviewed data reflecting the childhood vaccinations that are required by 49 states and D.C. for the 2022-23 school year, and compared those numbers to past years. Overall, 93% of kindergarteners had completed their state-required vaccinations last school year, down from 95% in the 2019-20 school year, while vaccine exemptions increased to 3%. In 10 states, more than 5% of kindergarteners had exemptions to their required vaccines—signifying increased risk of vaccine-preventable disease outbreaks in schools, according to the CDC.
Two quick updates about the CDC’s surveillance efforts for COVID-19 and other diseases:
The CDC has provided a short-term wastewater surveillance contract to Verily, the biotech company that’s affiliated with Google, so that data collection can continue at about 400 sewage testing sites while a longer-term contract is in dispute. This temporary measure will help keep up surveillance during the winter respiratory virus season, though Verily still has a lot of logistical work ahead to actually start testing at sites where another company, Biobot Analytics, was previously in charge. (Verily will need to contact the sites, send them equipment, set up sample collection procedures, etc.) The CDC’s National Wastewater Surveillance System is also working on an updated COVID-19 dashboard, according to POLITICO’s story about the short-term contract. For more context, see my coverage of the contract switch and POLITICO’s previous reporting.
The CDC is expanding its testing program for international travelers arriving at U.S. airports, in a three-month pilot program for the winter virus season. This program, called the Traveler-Based Genomic Surveillance program, has screened travelers for coronavirus variants over the last two years, primarily using PCR tests among travelers who volunteer for a nasal swab. This winter’s pilot program expands surveillance in two ways: adding about 30 testing targets (including flu, RSV, other common diseases, and markers of antimicrobial resistance), and adding wastewater testing at three airports. One airport, San Francisco’s international airport, was already providing samples from plane sewage. See my article in Science News for more details.
Editor’s note, November 27: Check out my new publication: The Sick Times, a new nonprofit news site chronicling the Long Covid crisis.
After more than three years, 165 weekly newsletters, and a lot of number-crunching, this is the last issue of the COVID-19 Data Dispatch. I am bidding farewell to this publication, with immense gratitude to everyone who has supported it. But this isn’t the last newsletter you’ll get from me about COVID-19 research and data; more on that below.
I’m ending the COVID-19 Data Dispatch for three reasons. First, there is simply less day-to-day COVID-19 data news these days than there was early in the pandemic. When I started writing this publication in summer 2020, there was a constant stream of data issues to explain, new resources coming online, confusing trends, and more. The stream has slowed a lot in the last year, especially after the federal public health emergency ended in May.
The COVID-19 pandemic certainly isn’t over, and COVID-19 is certainly still a significant health threat in the U.S. and all over the world. Millions of people continue to get this disease every week, of whom thousands go to the hospital, hundreds die, and many more are left with Long COVID. However, the specific focus area that I chose for this publication—data and surveillance—is no longer an active topic requiring dedicated coverage. Post-health emergency, U.S. data systems have settled into tracking COVID-19 with a similar lack of urgency to their tracking of other seasonal diseases, leaving me with less to write about on a weekly basis.
Second, writing a publication solo is a lot of work, and I’ve felt myself inching closer to burnout in recent months. I’ve primarily written the CDD on weekends, in my spare time from freelance projects. When I started this newsletter, the process worked well because CDD topics often lent themselves to later freelance articles and vice versa. These days, there’s less overlap, as media publications are less interested in COVID-19 news. While I’ve appreciated having this space to keep covering the topic, it has taken more time and energy to figure out what I’m writing from week to week. The weekly newsletter has felt less like a “passion project,” and more like a chore, which is always a red flag for me.
And the third reason is the most important: I’m getting ready to transition into a new publication. In the new publication, I will continue covering COVID-19—but with a new focus area. I’m also transitioning from a solo project to one with a team, which we hope will grow as the project receives donations and grant funding. I’m not sharing too many details here because this publication hasn’t been announced publicly yet, but you can expect to learn more about it soon.
Specifically: if you’re a COVID-19 Data Dispatch newsletter subscriber, expect an email from me in the coming days introducing my new publication. You’ll be welcome to unsubscribe from my emails if you aren’t interested in the new project; though I hope you’ll find that it will serve to help you navigate the continued pandemic just as the CDD has.
In the meantime, feel free to email me with any questions or concerns you have. And thank you for all the support over the last three years—for the comments, the questions, the donations, and the building of a small community that refuses to simply move on from the ongoing COVID-19 crisis. Thank you.
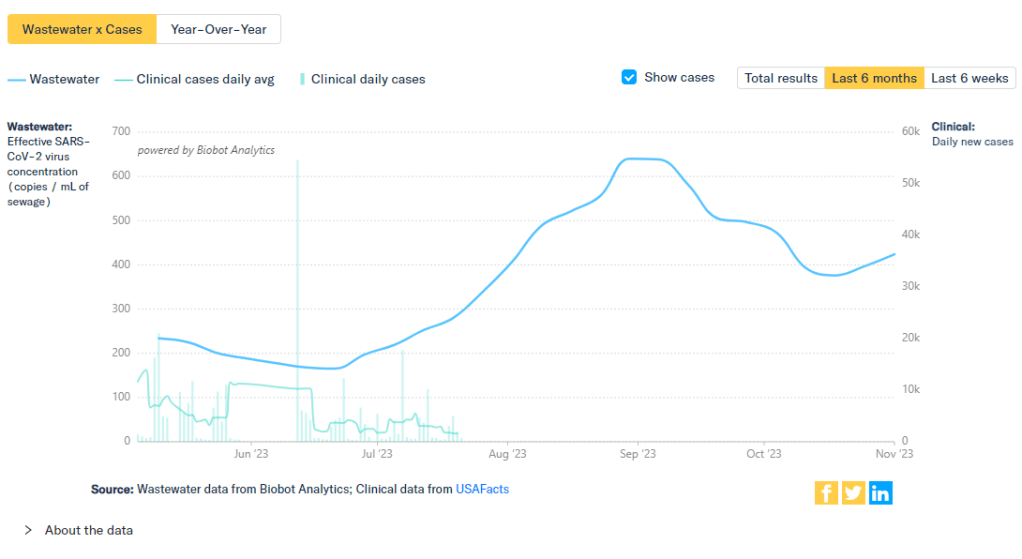
Biobot’s COVID-19 dashboard shows that coronavirus levels in wastewater have increased over the last two weeks.
During the most recent week of data available (October 22-28), the U.S. reported about 15,700 new COVID-19 patients admitted to hospitals, according to the CDC. This amounts to:
An average of 2,200 new admissions each day
4.8 total admissions for every 100,000 Americans
0.1% more new admissions than the prior week (October 15-21)
Additionally, the U.S. reported:
9% of tests in the CDC’s surveillance network came back positive
A 7% higher concentration of SARS-CoV-2 in wastewater than the prior week (as of November 1, per Biobot’s dashboard)
25% of new cases are caused by Omicron HV.1, 22% by EG.5, 17% by XBB.1.6, 12% by FL.1.5.1 (as of October 28)
Most of the numbers above are exactly copied from last week’s National Numbers post, as the CDC didn’t update its COVID-19 dashboard this week. Honestly, I have no idea why a single-day holiday (i.e. Veteran’s Day yesterday) might lead a national health agency to postpone its data updates for an entire week, but I’m sure this won’t be the last time it happens.
The new data we do have this week, mainly from wastewater dashboards, suggest that COVID-19 spread is increasing slightly along with other respiratory viruses. Data from Biobot and WastewaterSCAN show upticks in the last two weeks, following the declining spread from September through the end of October.
Biobot’s dashboard shows that the concentration of coronavirus in U.S. sewersheds has gone up about 13% on average nationally, from October 18 through November 1. Coronavirus levels are currently highest in the Midwest, with the West Coast and South showing signs of increasing spread while the Northeast is in a plateau.
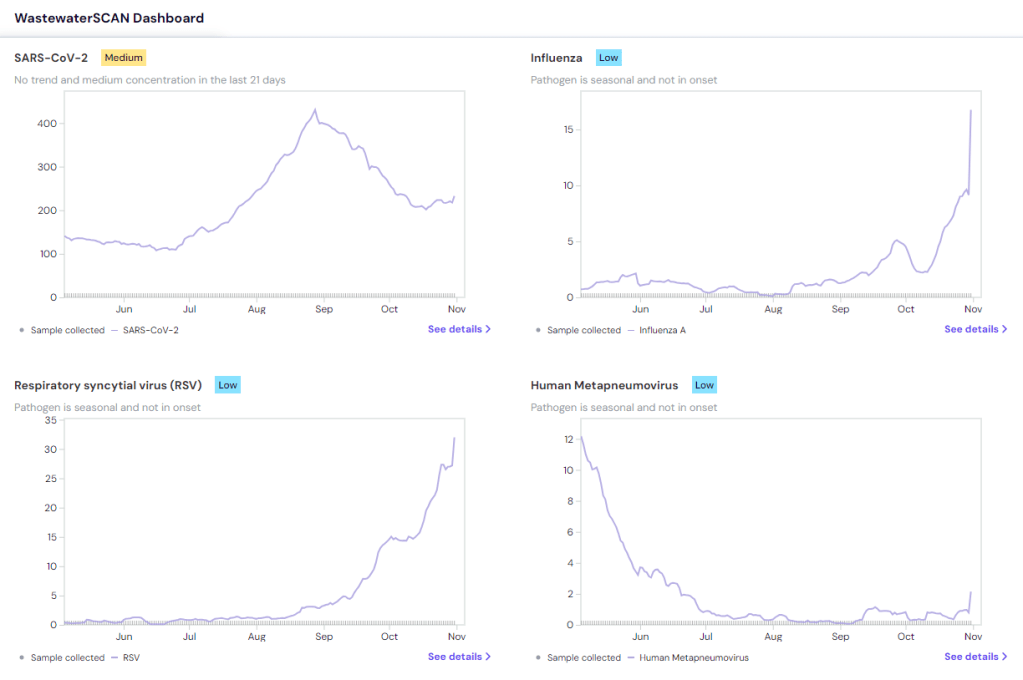
WastewaterSCAN’s dashboard presents a similar picture: the Midwest currently has high coronavirus levels, according to WWSCAN’s thresholds, while the other regions have moderate levels. This dashboard shows rising COVID-19 transmission in the Midwest and South as well, with cities like Warren, Michigan, Lincoln, Nebraska, and Arkon, Ohio reporting significant increases in recent weeks.
COVID-19 isn’t the only virus spreading a lot right now, according to WWSCAN and the CDC. The CDC said in its most recent flu surveillance report that this seasonal virus is increasing throughout the country, though it hasn’t yet reached typical flu season levels. This report was published over a week ago, on November 3, but it seems likely that the trend has continued this week.
Both wastewater surveillance and the CDC’s influenza-like activity surveillance, which tracks doctors’ visits for respiratory symptoms, suggest that the South is seeing increased spread of several viruses: COVID-19, flu, RSV, norovirus. Norovirus and RSV in particular are at high levels nationwide, according to WWSCAN.
Similar safety measures—masks, testing, improved ventilation, getting vaccinated—protect against many common diseases. Recent data from the CDC show that many people are, at least, getting vaccinated, though vaccination rates are currently much higher for flu than COVID-19 among both adults and children. (Public health agencies clearly have some work to do there.)
Last week, I shared an update about the Healthcare Infection Control Practices Advisory Committee (HICPAC), a group of advisors to the CDC that has been working on updated guidelines for limiting infectious disease spread in healthcare settings. The committee has faced criticism for failing to incorporate lessons from COVID-19 into its guidance, as well as for a lack of transparency in its operations.
The transparency issues continued this week, according to a press release by National Nurses United (NNU), a nurses union that’s been at the forefront of advocacy for better infection control guidelines. HICPAC only released a draft of its updated guidance on November 2, the day before it voted on the document. And it’s only giving the American public five days to review the document and provide feedback through public comments.
“HICPAC’s draft is permissive and weak and seeks not just to maintain existing practice — which has been shown to be inadequately protective — but even rolls back the use of some important measures, such as airborne infection isolation rooms,” said NNU president Zenei Triunfo-Cortez in a statement.
Despite calls to delay a vote on this document until hearing from healthcare workers and public health experts, HICPAC voted unanimously to finalize the guidance draft during its meeting this week. The vote indicates a lack of public transparency and a lack of consideration for relevant health expertise—which is troubling considering how influential this guidance is for setting standards in healthcare centers across the country.
For more details about HICPAC and instructions on making public comments, see this CDC webpage.
New respiratory virus dashboard for Europe: Residents of about 50 European countries can now follow respiratory virus trends for their nations on a new dashboard developed by the World Health Organization (WHO) and European Centre for Disease Prevention and Control (ECDC). The dashboard compiles data from patient visits to healthcare facilities, laboratory testing, and genetic sequencing of coronavirus variants, according to a press release by the ECDC. Viewers can find summary trends for influenza-like illness as well as specific trends for COVID-19, flu, and RSV. This dashboard is a great step forward for standardizing surveillance data across countries.
Medicaid unwinding update from KFF: This week, the Kaiser Family Foundation (KFF) published an update to its Medicaid Enrollment and Unwinding Tracker, which follows the Americans who lost their health insurance following the end of a Medicaid rule tied to the federal public health emergency for COVID-19. At least 10 million people have lost Medicaid coverage as of November 1, KFF reports, though the researchers acknowledge that this number is likely an undercount due to limited data. While disenrollment rates vary by state, overall, 71% of people who lost Medicaid coverage did so for “procedural reasons,” i.e. paperwork issues, according to KFF’s analysis.
New Long COVID prevalence estimates: In a new paper, published this week in PLOS ONE, researchers at Dartmouth and University College London estimate Long COVID prevalence in the U.S. based on six months of data from the U.S. Census and CDC’s Household Pulse Survey. (Longtime readers may remember that this survey is one of my personal favorite sources for Long COVID data.) About 14% of respondents surveyed between June and December 2022 reported that they had experienced Long COVID at some point, half of them during the time they were surveyed, the researchers found. Americans with less education and lower incomes were more likely to report Long COVID symptoms, and the condition was correlated with physical and mental difficulties such as trouble dressing and bathing.
Vaccine confidence falling in the U.S.: A new study from the Annenberg Public Policy Center at the University of Pennsylvania finds that vaccine confidence is declining for a variety of diseases, not just COVID-19. The researchers compared results from similar surveys conducted in October 2023 and in April 2021, both of which included about 1,600 people selected for a nationally representative sample. Confidence rates in COVID-19 vaccines dropped from 75% to 63%, while confidence rates that all vaccines approved in the U.S. are generally safe fell from 77% to 71%. At the same time, the researchers found that more survey respondents believed incorrect statements, such as that ivermectin was an effective treatment for COVID-19.
Reasons for masking in Japan: One more study that caught my attention this week, on a more positive note: a researcher at Osaka University examined Japanese use of masks for COVID-19. Among participants in the researcher’s online surveys, the majority reported still wearing masks in June 2023, even though COVID-19 guidelines in Japan became less strict earlier this year. Social norms in Japan contribute to this behavior, the survey found, as respondents reported that they continued to mask both to avoid infection and to appear “normal” in public spaces. The study provides data behind well-known social norms in Japan, while offering some hope to those of us “lone maskers” in places where the norms are quite different.
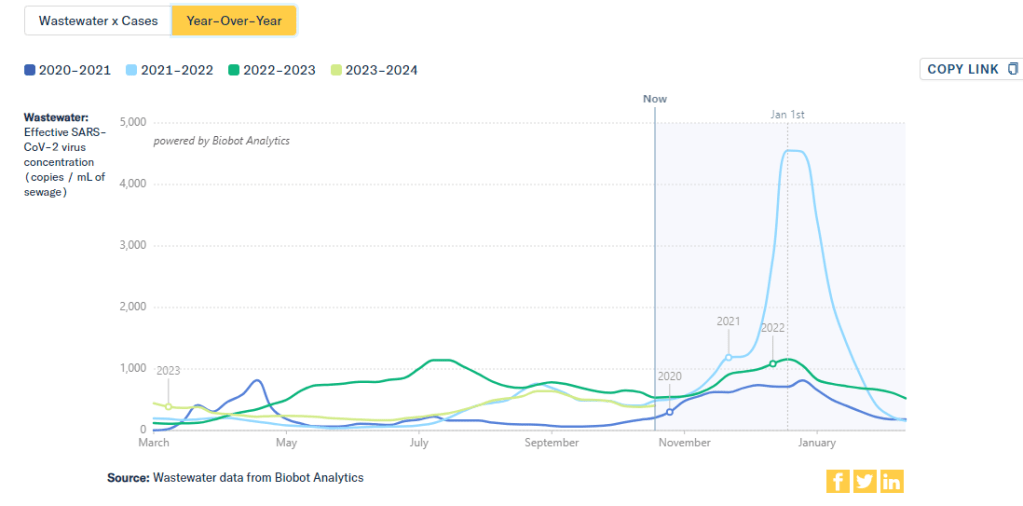
This chart from Biobot Analytics shows that current coronavirus levels in wastewater (the light green line) have followed a similar pattern to fall 2021 (light blue).
The U.S. is heading into our first winter since the end of the federal public health emergency for COVID-19. Those of us still following COVID-19 trends might need to change which data sources we use to track the disease this winter, and how we think about trends.
The pandemic certainly hasn’t ended: COVID-19 still leads to hundreds of hospitalizations and deaths each day, not to mention millions with Long COVID. Since the U.S. government ended its emergency response to this disease, we now have significantly less information—but not zero information—about how it’s spreading.
The CDC is no longer collecting case data, as it lost authority to require reporting from PCR testing labs.
Following the CDC’s lead, many state and local health departments have also stopped tracking COVID-19 cases.
The CDC is still tracking COVID-19 hospitalizations, though these data are more delayed and less comprehensive following the PHE’s end.
Death reporting is also more delayed and less comprehensive.
The CDC is using networks of testing labs and healthcare centers (like the National Respiratory and Enteric Virus Surveillance System) to estimate COVID-19 trends, similar to its strategies for tracking flu and RSV.
To track variants, the CDC is relying on a mix of continued PCR samples, wastewater testing, and travel surveillance.
In short, we lost a few of the primary data sources that people have used to follow COVID-19 over the last three years. But there’s still a lot of data available, primarily from wastewater surveillance, the CDC’s sentinel networks, and local health agencies.
Here are my tips for tracking COVID-19 this winter.
Look at multiple sources for your community.
Following COVID-19 in your city or state used to be easy: you could just look at case numbers. Now, with that metric unavailable in many places, I would recommend having two or three go-to data sources that you check in tandem. Don’t be certain about a trend (like a new surge) until you’ve seen it in multiple sources at once. These sources might be local wastewater pages, local health department pages, and regional trends from the CDC.
For example, when I want to check on COVID-19 spread in New York City (where I live), I look at:
It’s pretty universally acknowledged among epidemiologists and public health experts at this point in the pandemic that, without case data, wastewater surveillance is now our best way to spot new changes in COVID-19 spread. When a new surge occurs, coronavirus levels in wastewater tend to go up days or weeks before other metrics, like hospitalizations.
So, as you track COVID-19 for your community, I would highly recommend that one of your top sources is a wastewater surveillance dashboard.
In addition to local health dashboards, you might find an academic project near you that’s monitoring wastewater. Check the COVIDPoops19 dashboard for a more comprehensive repository of wastewater surveillance projects.
Test positivity is still helpful for trends.
Test positivity—the rate of COVID-19 tests that returned positive results—was a popular indicator early in the pandemic, with policy decisions like whether students could attend school in-person tied to this metric. While test positivity numbers are less available now, people are still getting tested for COVID-19: these tests mostly occur in healthcare settings among people who present with COVID-like symptoms or had recent exposures to the virus.
I still find test positivity to be a helpful metric for watching trends in COVID-19 spread. When the positivity rate goes up, more people are getting COVID-19; and when the rate goes over 10%, that’s a decent indicator that the disease is spreading in significant magnitudes.
Two places to find test positivity data:
The CDC’s COVID-19 trends page provides positivity data for the U.S. as a whole and HHS regions, based on one of the agency’s respiratory virus surveillance networks;
Acknowledge data delays, especially around holidays.
Many COVID-19 dashboards used to update on a daily basis. Now, we get weekly updates from most health agencies—and even less frequency in some places. With these update schedules, all data are inevitably delayed by at least a few days. So, when you look at a dashboard, it’s important to keep the update schedule in mind and ask yourself how a trend might have continued following the most recent data available.
Data delays become particularly prominent after holidays: remember, public health officials take days off just like the rest of us. Holiday reporting delays often lead to appearances of low COVID-19 during the immediate week of a holiday, followed by appearances of higher COVID-19 in the weeks after as cases (and other metrics) are retroactively reported. The weeks around Christmas and New Year’s are particularly bad, as most people take both of those holidays off.
Compare current trends to past surges and lulls.
With interpreting COVID-19 data, context is everything. Spread of the virus is usually either rising or falling; comparing current numbers to historical data can help you understand the magnitude of those recent patterns. Is your community seeing as much COVID-19 as it has at past times commonly recognized as surges? Or are you in more of a lull between waves?
One helpful tool that I often use for such context is a chart on Biobot’s COVID-19 dashboard that provides year-over-year comparisons between coronavirus levels in wastewater in the U.S. Right now, for example, you can see that current viral levels have followed a similar trendline to what we observed in the fall 2021 Delta surge (before Omicron appeared), but lower than this time last year (when different BA variants were spreading quickly).
The original Omicron surge in winter 2021-22 is often a popular point for these comparisons, as pundits love to assure us that a new variant won’t cause as intense a wave as we saw with Omicron’s first appearance. While this can be reassuring, I think it’s important to not just look at the highest peaks for comparison. The summer/fall of Delta in 2021 wasn’t a great time either, and we’re on track to repeat it right now even if no wildly competitive new variants appear.
Keep an eye on variants.
As we watch for a likely COVID-19 surge this winter, viral variants could have an impact on how much the virus is able to spread during our holiday travel and gatherings. You can keep an eye on variant development through a couple of CDC data pages:
Variant patterns from wastewater, which the CDC and local health departments track from select sewage testing sites (many state and local wastewater dashboards include these data as well);
Travel-based genomic surveillance, a CDC program in which international travelers can opt into PCR testing as they return to U.S. airports, contributing to the agency’s understanding of variants circulating globally.
If you have further data tracking questions or suggestions, please reach out via email or in the comments below.
During the most recent week of data available (October 22-28), the U.S. reported about 15,700 new COVID-19 patients admitted to hospitals, according to the CDC. This amounts to:
An average of 2,200 new admissions each day
4.8 total admissions for every 100,000 Americans
0.1% more new admissions than the prior week (October 15-21)
Additionally, the U.S. reported:
9% of tests in the CDC’s surveillance network came back positive
A 6% higher concentration of SARS-CoV-2 in wastewater than the prior week (as of October 25, per Biobot’s dashboard)
25% of new cases are caused by Omicron HV.1, 22% by EG.5, 17% by XBB.1.6, 12% by FL.1.5.1 (as of October 28)
After an early-fall lull in COVID-19 transmission, there are now signs that the coronavirus is starting to spread more as we head into winter (or, respiratory virus season). This slight uptick is expected, but could still be prevented if we had better public health measures in place.
Wastewater surveillance data from both Biobot Analytics and WastewaterSCAN suggest that COVID-19 spread might be increasing again. Biobot’s dashboard shows a 6% increase in sewage coronavirus levels nationally between October 18 and October 25, the most recent week of data available.
WastewaterSCAN’s dashboard similarly shows a slight increase in coronavirus levels, as of October 30. Regional data from both sources suggest that the Northeast and Midwest are seeing more COVID-19 spread than other regions at the moment, though the South might catch up in the coming weeks.
As I’ve discussed over the last couple of weeks, we are currently working with limited wastewater surveillance data: 400 sewage testing sites, about one-quarter of the CDC’s wastewater network, are currently in limbo while government officials navigate a potential switch between testing contractors. (See last week’s National Numbers and my original coverage of the new contract.) Still, we have enough information to identify national trends from wastewater.
Along with the wastewater surveillance data, hospitalization data reported by the CDC show a very slight increase in COVID-19 patients as of October 28. Test positivity and emergency department visits have plateaued after declines over the course of October, as seen in both the CDC’s data and the Walgreens dashboard (which provides data from testing done at this pharmacy chain).
COVID-19 isn’t the only respiratory disease spreading right now. RSV transmission has picked up, according to the CDC’s surveillance: hospitalization rates for this disease have risen sharply over the last month. Similarly to last year, RSV appears to be reaching its peak earlier in the fall than health officials typically expect.
WastewaterSCAN’s data show RSV and flu spread ticking up, particularly in the South. This project’s data align with the CDC’s reports of influenza-like illness, which suggest southern states, Washington D.C., and Alaska now have moderate to high levels of people with flu-like symptoms, compared to low levels in the rest of the country.
While health experts are expecting a lot of respiratory virus spread this winter, these trends aren’t inevitable. All individual and collective measures towards public health—getting vaccinated, wearing masks, testing, prioritizing ventilation—help mitigate these diseases.
A couple of months ago, I wrote about the Healthcare Infection Control Practices Advisory Committee (HICPAC), a group of experts that’s been working on updating CDC guidance for infectious disease safety measures in healthcare settings. The committee’s work has come under scrutiny for failing to actually improve safety with lessons learned from COVID-19.
As outside health experts and advocates push HICPAC to consider improving mask standards, ventilation, and related guidance in healthcare settings, one group has led the advocacy effort: National Nurses United (NNU). This group is the largest nurses union in the U.S., with nearly 225,000 members and a lot of professional experience supporting better healthcare safety.
NNU’s organizing efforts around the HICPAC guidance have included a number of letters and petitions to the CDC, organizing speakers at the public comment sections of HICPAC meetings, and pushing for greater transparency around how the committee makes decisions. The nurses’ organization recently released documents summarizing meetings of HICPAC committee members working on the new infection control guidance, which it received through public records requests. The documents show how this group “has prioritized employer costs and profits over robust protections for health care workers and patients,” NNU says.
I’m writing about NNU’s efforts again now because HICPAC has another public meeting coming up this week, on November 2 and 3. If you’re interested in advocating for the committee to prioritize safety for workers and patients—not costs and profits—you can register to make a comment at the meeting. You can also sign onto a NNU petition asking the CDC to release the draft of HICPAC’s updated safety guidance.